A newer version of this document is available. Customers should click here to go to the newest version.
Window: NC Device States - Platform Power Analysis
To access this window: Select the Platform Power Analysis viewpoint and click the NC Device States sub-tab in the result tab.
Use the NC Device States window to:
- Identify the time spent in D0ix states by each device.
- Analyze the trend of D0ix state residency over time.
- Review the percent of time a device spent in a particular D0ix state.
The North complex contains the compute intensive components (for example, video decode, image processing, and others). D0ix states are low-power states used on system on a chip (SoC) platforms.
Platform Power Analysis viewpoint is available as part of energy analysis. Collecting energy analysis with Intel® SoC Watch is available for target Android*, Windows*, or Linux* devices. Import and viewing of the Intel SoC Watch results is supported with any version of the VTune Profiler.
North Complex Device States Pane

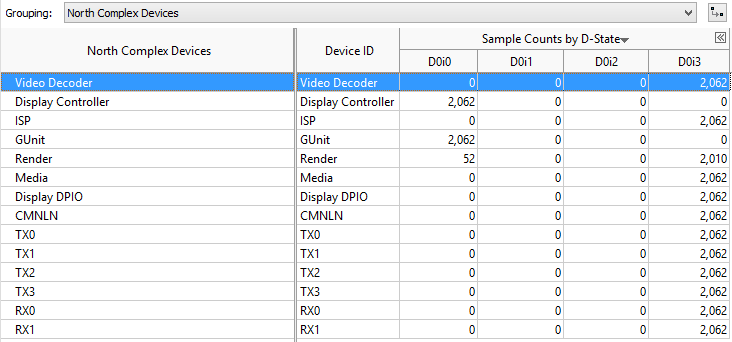
The North Complex Device States pane shows the list of devices in the North complex and displays the sample counts for each device. Click the expand![]() /collapse
/collapse![]() buttons in the data columns to expand the column and show data for different D0ix states in each device. You can change the unit displayed by right-clicking a data cell and selecting the Show Data As option to select an alternate unit. For example, you could select Show Data As > Percent to view the percent of collection time a particular device spent in the active state.
buttons in the data columns to expand the column and show data for different D0ix states in each device. You can change the unit displayed by right-clicking a data cell and selecting the Show Data As option to select an alternate unit. For example, you could select Show Data As > Percent to view the percent of collection time a particular device spent in the active state.
A device remaining in the active state (D0i0) can prevent the system from entering a deep sleep state (S0ix). Compare device time spent in the active state with System Sleep States or Graphics C/P State.
Timeline Pane

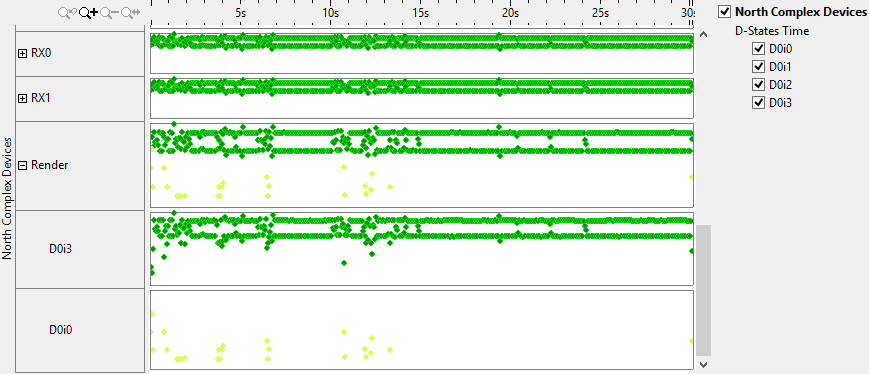
The Timeline pane displays the D0ix states of each device at each point when the data was read. Each state is shown in a different color. Use the legend on the right to add or remove D0ix states from the timeline. Hover over a data point to see the percentage of time spent in each state. Zoom in or out on the timeline to view trends in more detail. Filters applied on a timeline in one window are applied on all other windows within the viewpoint. This is useful if you identify an issue on one tab and want to see how the issue impacts the metrics shown on a different tab. The following example shows a zoomed-in view of the result above to show individual data points.
