Visible to Intel only — GUID: lro1448910215721
Ixiasoft
1.1. Introduction
1.2. Bare Metal Overview
1.3. Prerequisites for the Bare Metal Development Environment
1.4. Bare Metal Compiler
1.5. Bare Metal Development Flow
1.6. Using DS-5 AE to Create and Manage Bare Metal Projects
1.7. Importing, Building and Debugging in a Make-Based Example
1.8. DS-5 ARM HWLIBs Project Derived from Make-Based Project
1.9. Minimal Preloader
1.10. Appendix: Troubleshooting
Visible to Intel only — GUID: lro1448910215721
Ixiasoft
1.6.1.3. Build and Debug the Project
- Then, right click on the project and select "Build Project".
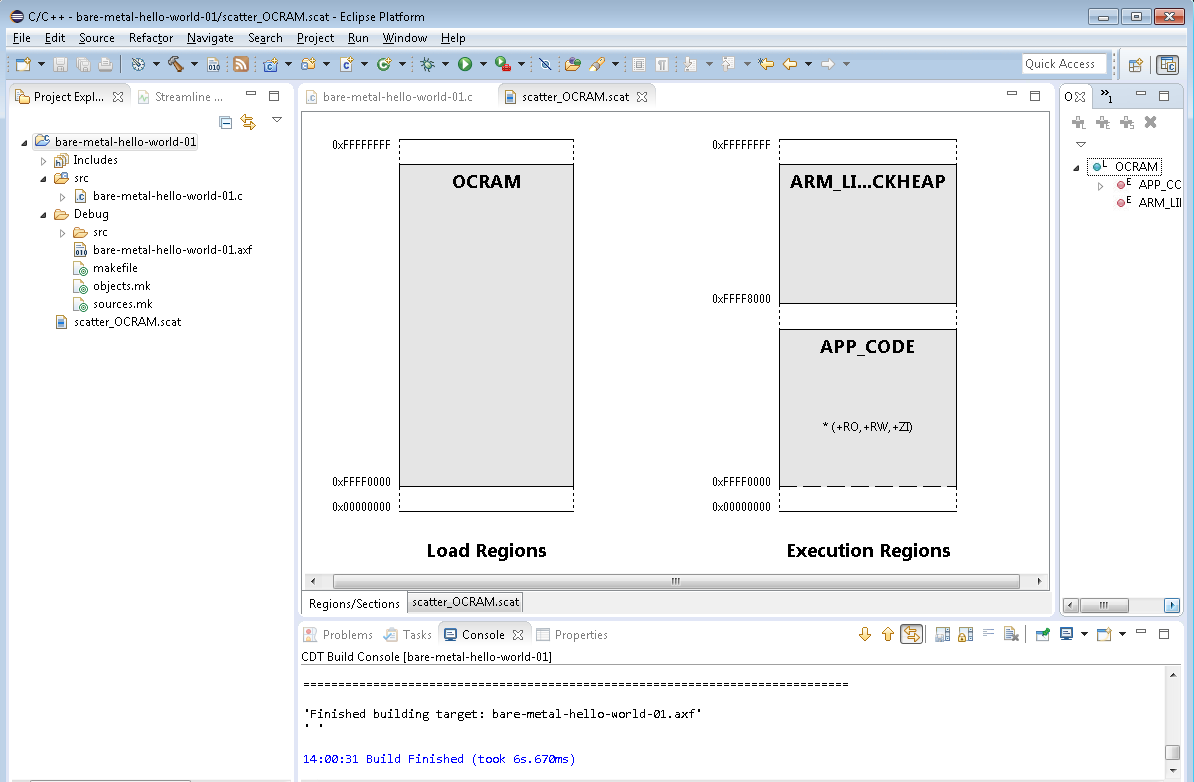
The “Debug” build directory will be created and the compiled object modules will be placed there.Figure 13. Bare Metal "Hello World - 01" Built Done
- To download and debug the program, select Run > Debug Configurations.
- Right click on DS-5 Debugger and select New to create a new debug configuration.
Figure 14. New Debug Configuration
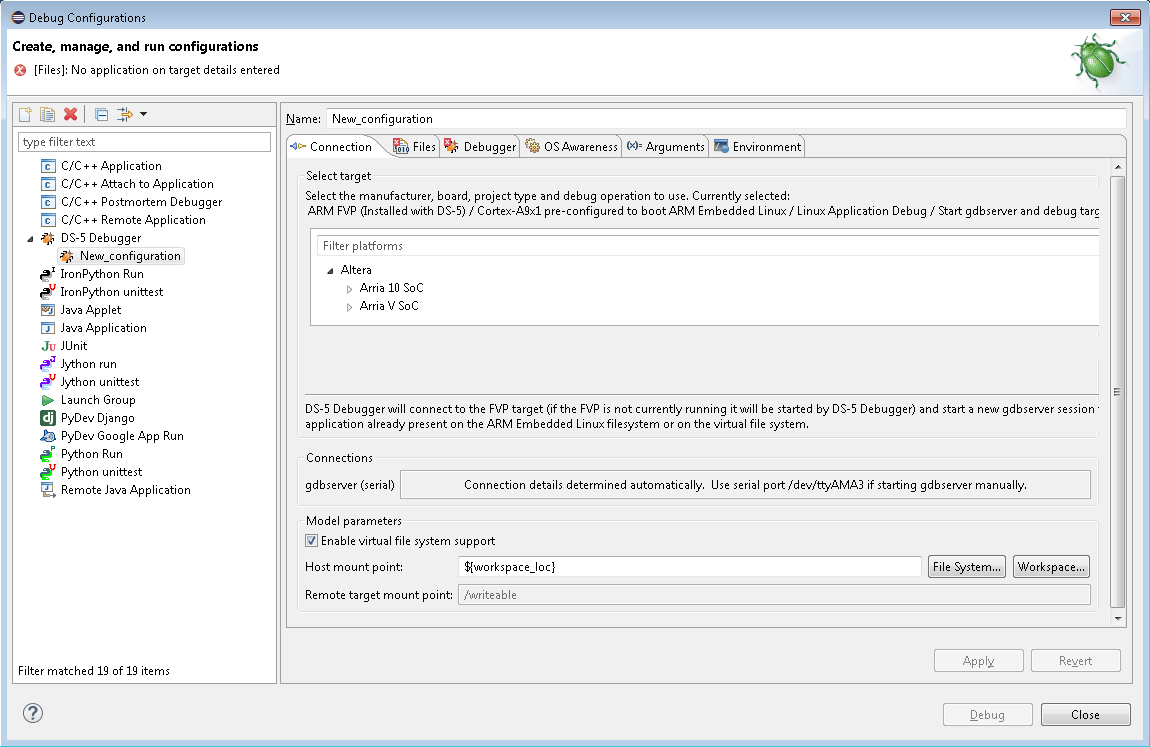
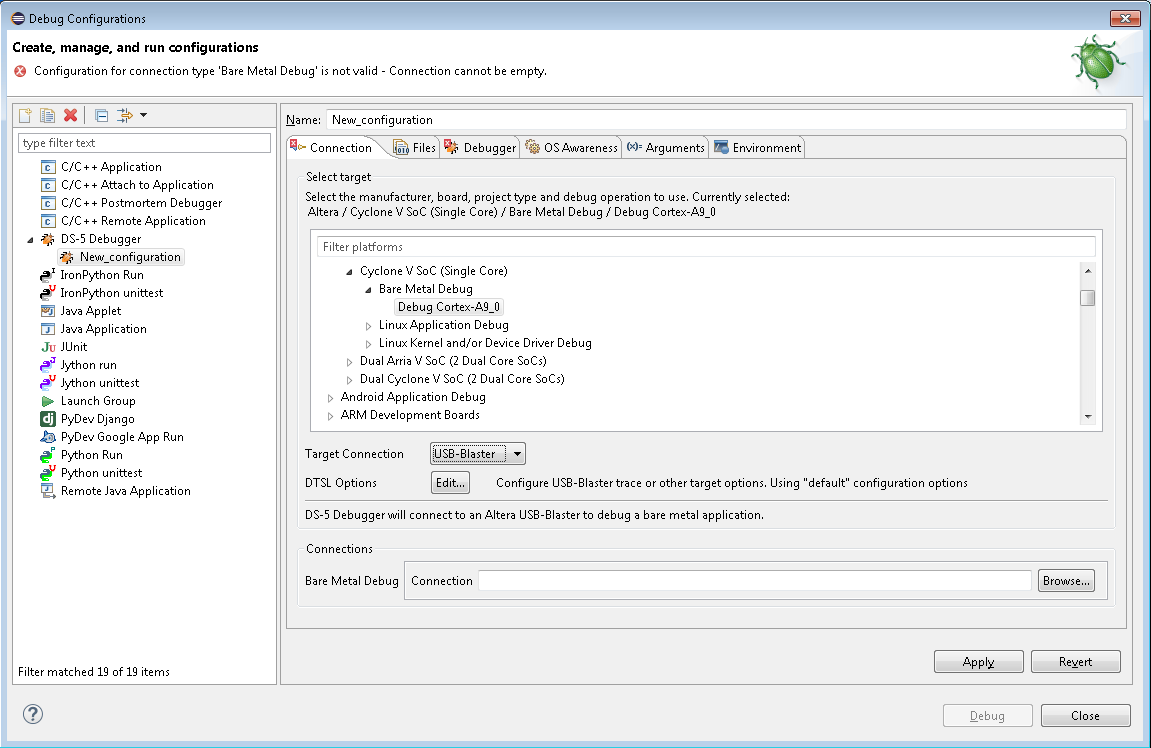
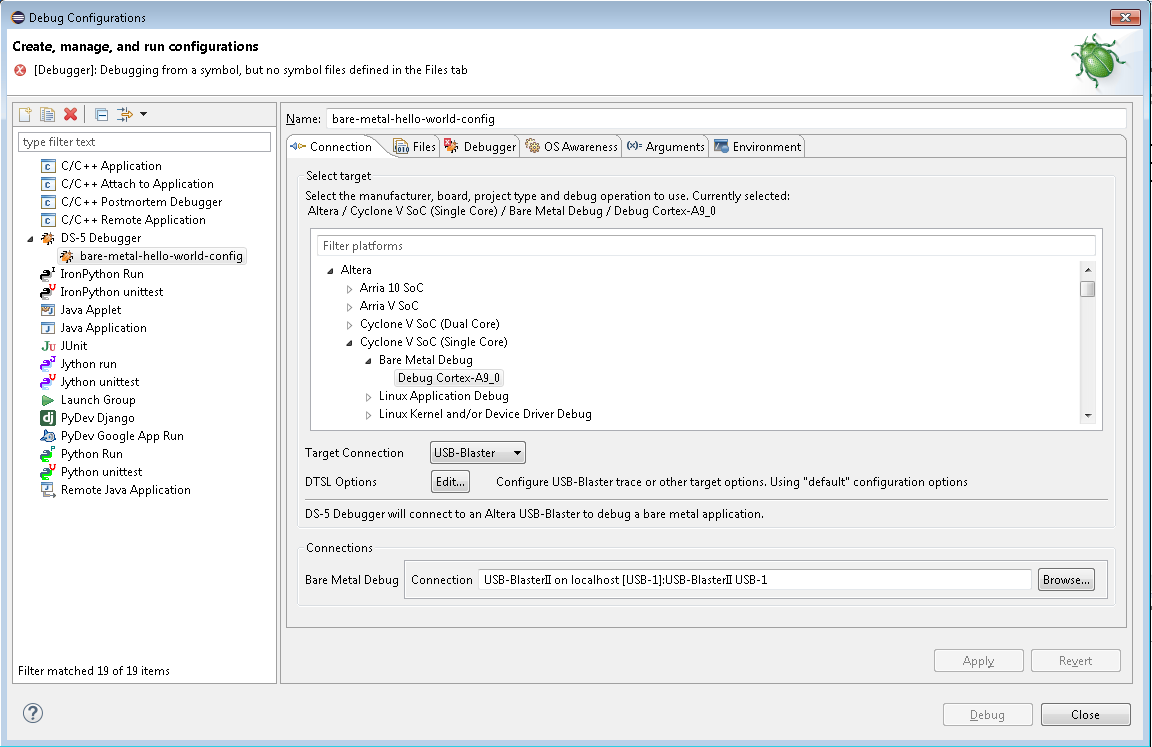
- In the Connection tab, select Altera > Cyclone V SoC (Single Core) > Bare Metal Debug > Debug Cortex-A9_0 and select "USB-Blaster" from the Target Connection pull-down menu.
Figure 15. New Debug Configuration Target Connection Setting
- Select an available Bare Metal Debug Connection by clicking Browse.
This will return a list of the available debug connections.Figure 16. Connection Browser
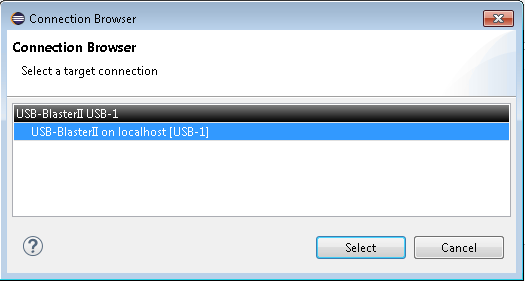
- Select the hardware and then click Select. Change the name of the configuration from "New_Configuration" to "bare-metal-hello-world-config", and select Apply.
Figure 17. Bare Metal Hello World Config Connection Settings
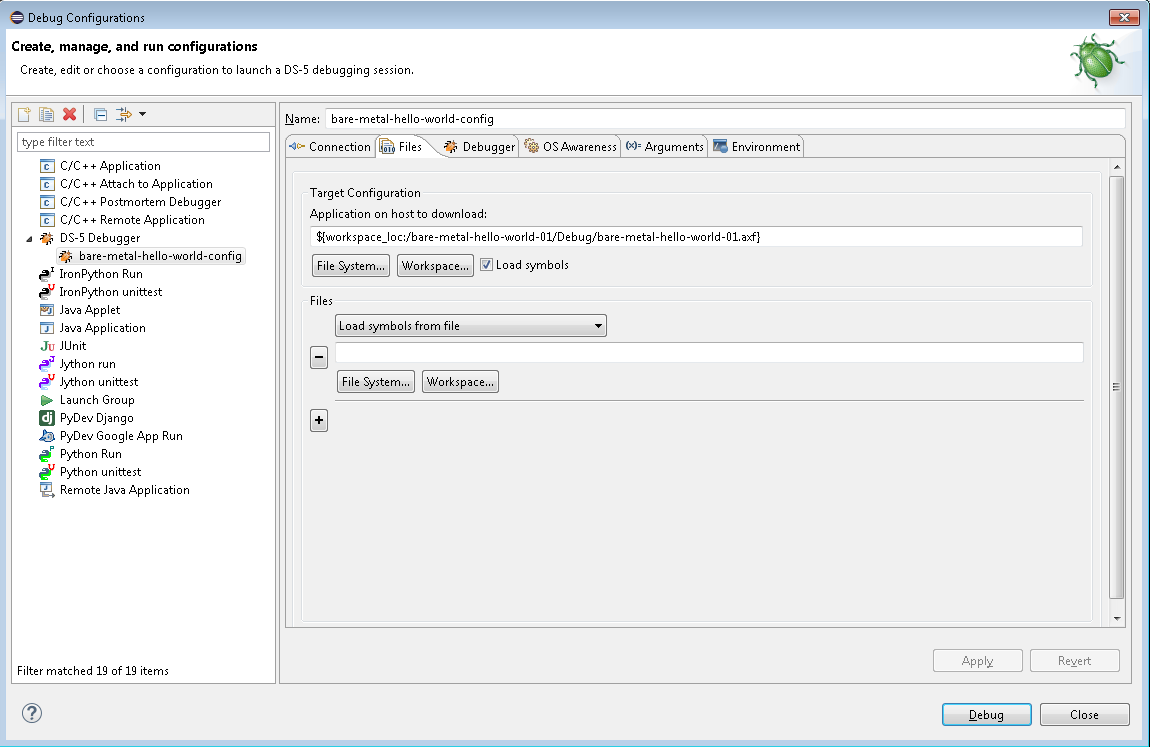
- Go to the Files tab and select the application to download by clicking “Workspace” and select the object module that was built, bare-metal-hello-world-01.axf.
It should be in the Debug folder within the project. Make sure that “Load symbols” is selected, and then click on Apply.Figure 18. Bare Metal Hello World Config Files Settings
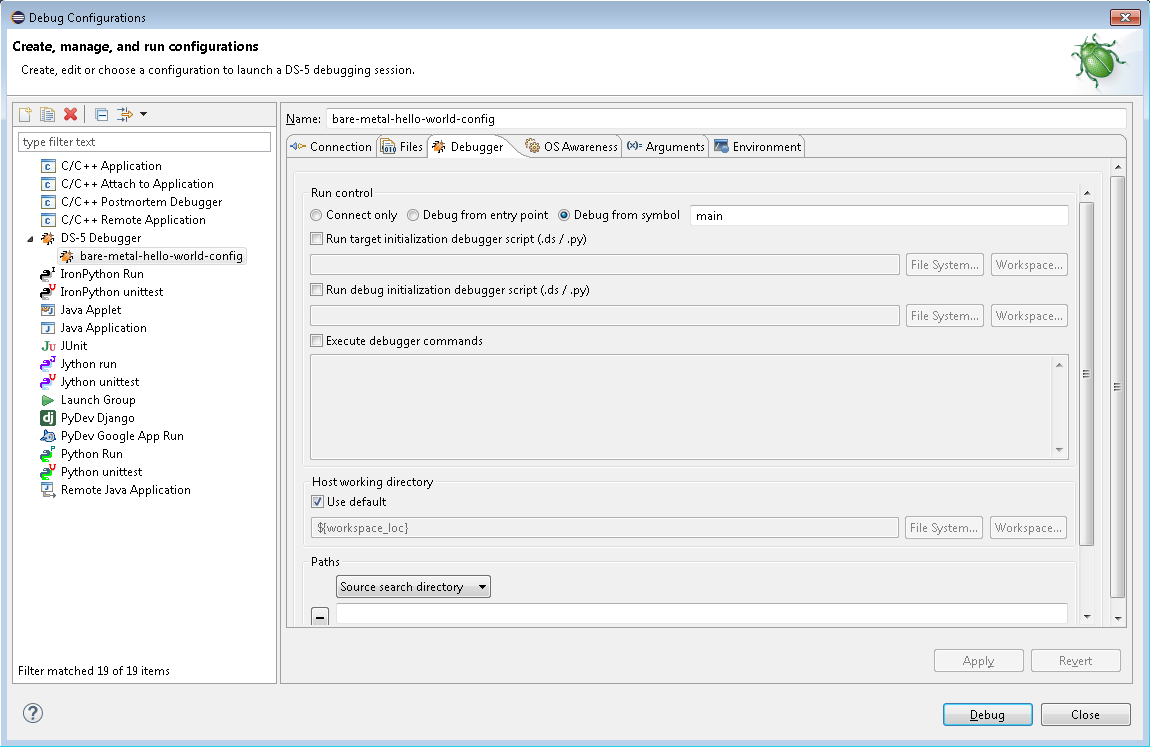
- Go to the Debugger tab and make sure that under Run control, Debug from symbol is set to "main".
Figure 19. Bare Metal Hello World Config Debugger Settings
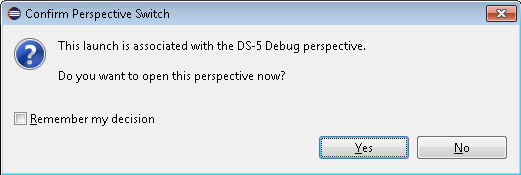
- Select Debug to load and debug the application.
It runs a query to change to the DS-5 Debug Perspective. Select Yes.Figure 20. Confirm Perspective Switch
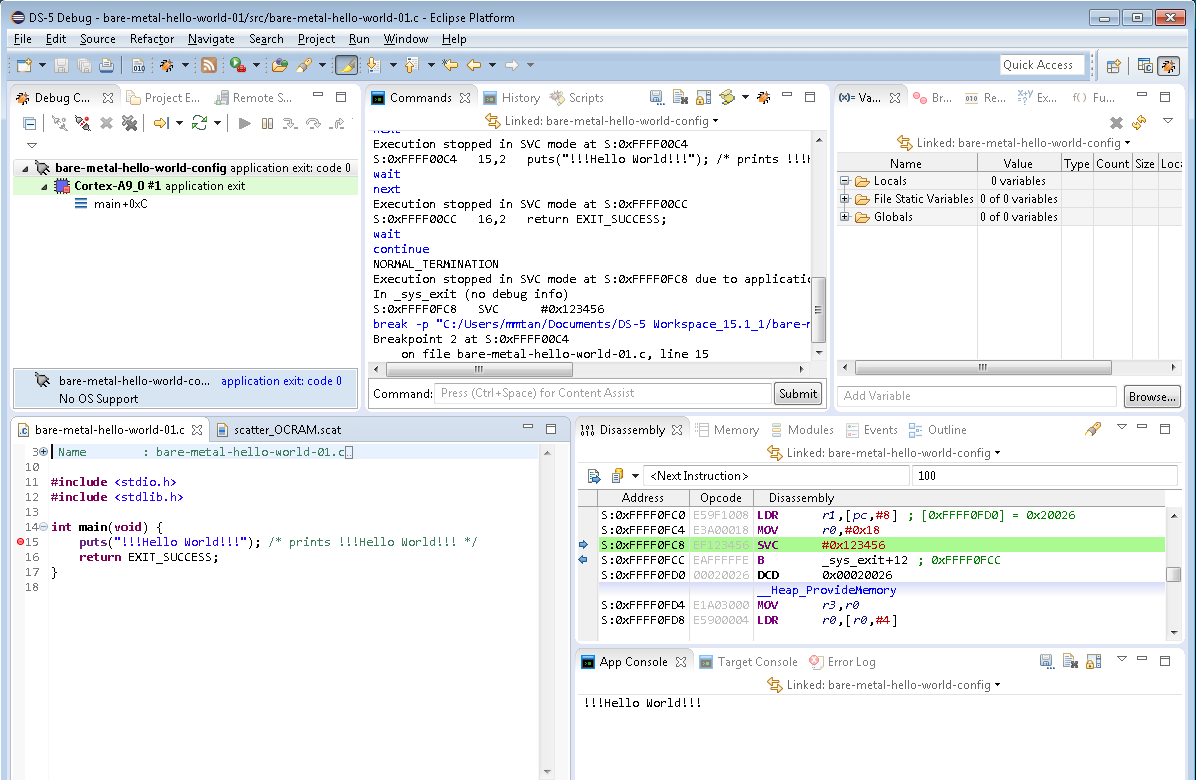
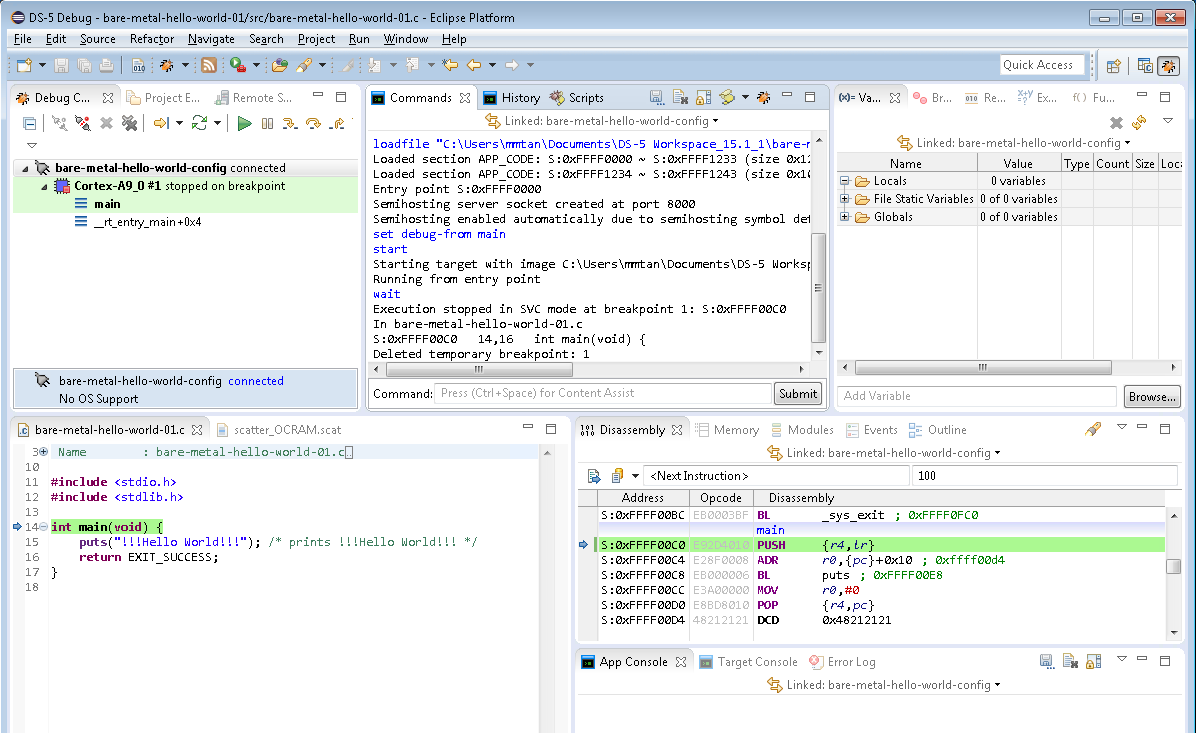
- It switches to the DS-5 Debug Perspective and then download and begin to run the application.
The program stops at main and waits there. In the Commands view, notice the entry point is 0xFFFF0000, which is the start address specified in the scatter file for the on-chip RAM.Figure 21. OCRAM Debug Stop at Main
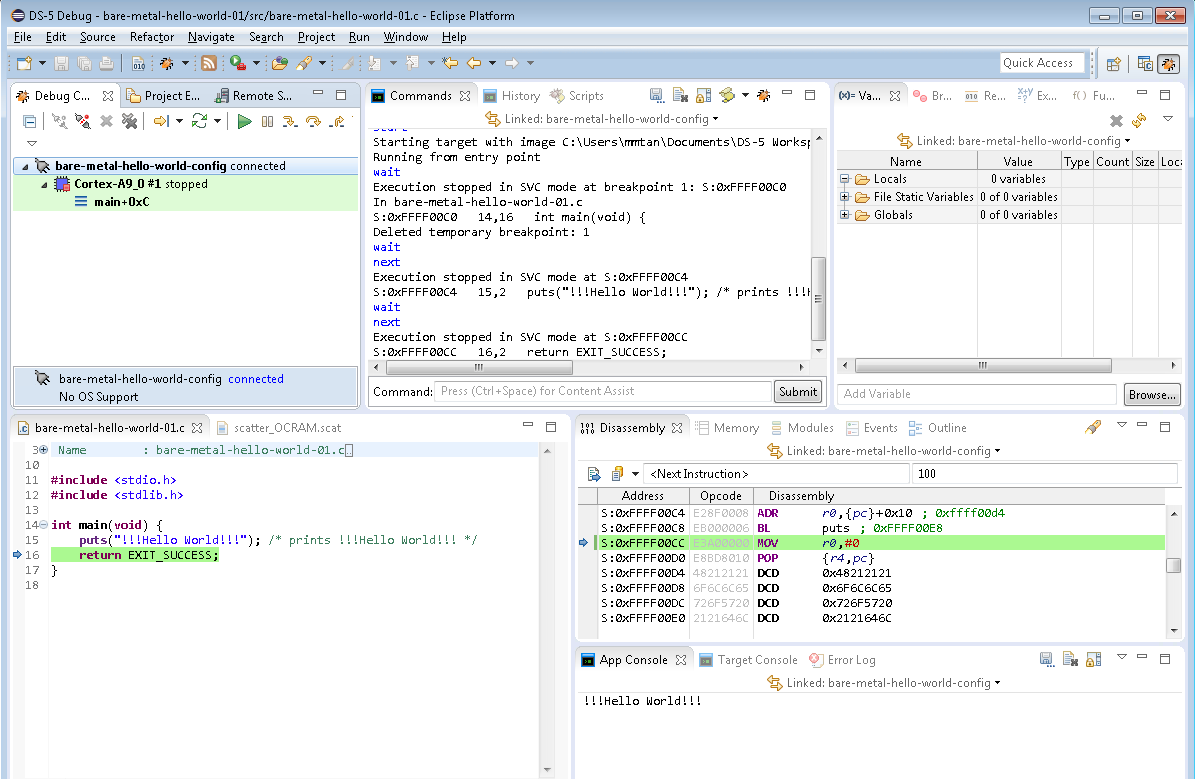
- Click the Step Over Source Line icon or press F6.
- Then "Step" again.
The output appears on the App Console view.Figure 22. "App Console" Output
- Select Continue to exit out of the application.
- Create a breakpoint by double clicking on the left margin of the bare-metal-hello-world-0.1.c Source view. If the Breakpoints view is not shown, then open it by selecting: View > Show View > Breakpoints.
Figure 23. Debug Breakpoint Setup