Developer Guide for Intel® SDK for OpenCL™ Applications 2017
A newer version of this document is available. Customers should click here to go to the newest version.
Visible to Intel only — GUID: GUID-5776A75B-8FCA-429B-A54A-39CFA09518C5
Visible to Intel only — GUID: GUID-5776A75B-8FCA-429B-A54A-39CFA09518C5
Viewing the Analysis Results
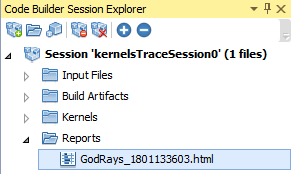
Once analysis is completed, several reports are generated. A new report is generated for each analysis run.
The reports are available under the Reports node in the Code Builder Session Explorer window.
The analysis reports are HTML files, saved be default in the session directory and can be viewed in any modern web-browser.
Each report contains several views:
- Session Info - provides information about the application that was analyzed and the command line to run the analysis. Also provides the kernel code for viewing.
- Execution Analysis - provides information on execution times statistics and on the best and worst configurations.
- Variables View - provides information on the read and read back time of the memory object being used in the kernel and allows you to see their content.
You can toggle between the views through the Report Selection combo box located at the top of the report's layout.