Visible to Intel only — GUID: GUID-21FA007E-E179-4C4E-AC55-C9B3C6213822
Legal Information
Getting Help and Support
Introducing the Intel® SDK for OpenCL™ Applications
What's New in This Release
Which Version of the Intel® SDK for OpenCL™ Applications Should I Use?
Intel® Code Builder for OpenCL™ API Plug-in for Microsoft Visual Studio*
Intel® Code Builder for OpenCL™ API Plug-in for Eclipse*
Debugging OpenCL™ Kernels on GPU
Intel® SDK for OpenCL™ Applications Standalone Version
OpenCL™ 2.1 Development Environment
Intel® FPGA Emulation Platform for OpenCL™ Getting Started Guide
Troubleshooting Intel® SDK for OpenCL™ Applications Issues
Configuring Microsoft Visual Studio* IDE
Converting an Existing Project into an OpenCL™ Project
OpenCL™ New Project Wizard
Building an OpenCL™ Project
Using OpenCL™ Build Properties
Selecting a Target OpenCL™ Device
Generating and Viewing Assembly Code
Generating and Viewing LLVM Code
Generating Intermediate Program Binaries with Intel® Code Builder for OpenCL™ API Plug-in
Configuring OpenCL™ Build Options
Visible to Intel only — GUID: GUID-21FA007E-E179-4C4E-AC55-C9B3C6213822
Problems View
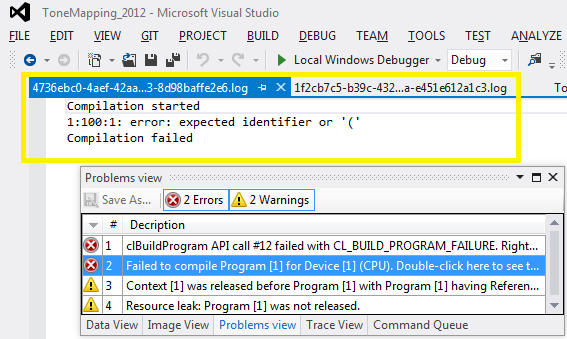
Intel® SDK for OpenCL™Applications - API Debugger plug-in for Microsoft Visual Studio* IDE provides the Problems View that summarizes into a single view all errors and warnings that occurred during the execution.
To access the view, select Tools > Intel Code Builder for OpenCL API > OpenCL API Debugger > Problems View.
Problems View supports the following features:
- Displaying warnings and errors of kernel compilation.
- Showing uninitialized kernel arguments, each one of them is set by calling clSetKernelArg() for each argument.
- Releasing OpenCL objects in the out-of-order mode, for example, when you release a program object before releasing its kernels (clReleaseProgram before clReleaseKernel).
- Resource leaks: at the end of the program, an error entry is added for each OpenCL resource (programs, buffers, images, and so on) that is not released
- API call failures - when an OpenCL API call fails, an error entry is added to the problems view. You can right-click the entry, to jump to the line item in the trace view that caused the failure.
Double-clicking an error in the Problems View opens the compilation error log message in the code editing area.
