Visible to Intel only — GUID: GUID-AA3AEEDF-7181-4494-A9C9-DD25AD7BF040
Visible to Intel only — GUID: GUID-AA3AEEDF-7181-4494-A9C9-DD25AD7BF040
Trace View
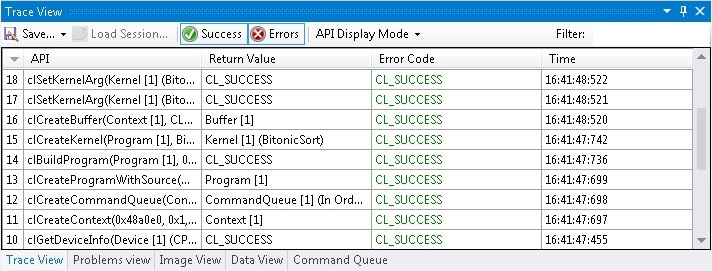
The trace view contains trace of all OpenCL™ API Calls during the execution, API call arguments, returned values, error codes, and time of execution.
To access the trace view, select Tools > Intel Code Builder for OpenCL API > OpenCL API Debugger > Trace View.

Use the following buttons to control the view:
- Save - enables saving the current state of all views with live OpenCL objects, API trace, command queue, and so on, to either a binary file (.trace) that can be later loaded with the Load Session button, or you can export a list (trace) of all API calls into a CSV file.
- Load Session... - enables restoring the state of the views from a previously saved .trace file either using Save As... or Generate trace file option in the API Debugger settings.
NOTE:This feature is available only when Visual Studio* IDE is not in debug mode, as views are synced with the application you debug.
- Success/Errors - enables filtering successful or failed API calls.
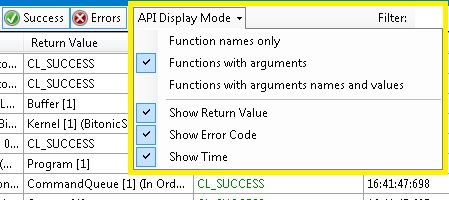
- API Display Mode - toggles between views:
- Function name only
- Function name and arguments
- Function name with argument names and values
- Show Return Value
- Show Error Code
- Show Time

- Filter - enables filtering out API calls by name. Start typing "device [1]" for example, to get only API calls using "device [1]"

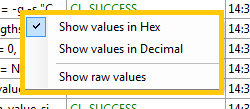
- Right-click context menu - enables toggling between various display modes of arguments Hex\Decimal, and show raw values (for example, 0x2 instead of CL_DEVICE_TYPE_CPU).

To enable automatic trace generation, select Tools > IntelCode Builder for OpenCL API >OpenCL API Debugger > API Debugger > Auto-generate session. Traces are saved in the folder that is specified in the Output Folder text box.
Automatic trace generation is an equivalent to clicking Save... after the host application ended.