Developer Guide for Intel® SDK for OpenCL™ Applications 2017
A newer version of this document is available. Customers should click here to go to the newest version.
Visible to Intel only — GUID: GUID-55FC045C-6D04-48A8-B420-154BDECBCC27
Visible to Intel only — GUID: GUID-55FC045C-6D04-48A8-B420-154BDECBCC27
Debugging OpenCL™ Kernels
This topic demonstrates how to use the Intel® SDK for OpenCL™ Applications - GPU Kernel Debugger to debug an OpenCL sample application on a Linux* OS. The steps below use the "Median Filter" OpenCL sample application to show the debugging process.
Building and Running the Sample Application
Before you continue, make sure you have downloaded the Median Filter sample application, which is used for further demonstration.
- Unpack the sample and build it running the make command from the unpacked MedianFilter directory:
-bash-4.2$ cd MedianFilter/
-bash-4.2$ make
- Run the sample:
-bash-4.2$ ./MedianFilter
Platforms (1):
    [0] Intel(R) OpenCL [Selected]
Devices (2):
    [0] Intel(R) HD Graphics [Selected]
    [1] Intel(R) Core(TM) m5-6Y57 CPU @ 1.10GHz
Input size is 4096 X 4096
OpenCL data alignment is 4096 bytes.
Save Image: MedianFilterInput.bmp
Executing OpenCL kernel...
Save Image: MedianFilterOutput.bmp
Executing reference...
Save Image: MedianFilterOutputReference.bmp
Performing verification...
Verification succeeded.
NDRange perf. counter time 38.953064 ms.
-bash-4.2$
If you were able to successfully run it, you will get an output similar to the above, otherwise please consult the documentation for the Graphics Driver installation.
Debug Demonstration
In the demo, one physical Linux* machine is used both as the host and target machine. The host machine (which is also the target) will be connected remotely and three PuTTY* terminals will be used for launching gdb, gdbserver-igfx and the sample.
- Launch gdbserver in the terminal 1:
/usr/bin/gdbserver-igfx :1234 --attach 123

Launch the sample under debug in the terminal 2:
export IGFXDBG_OVERRIDE_CLIENT_PID=123
cd /tmp/intel_ocl_median_filter/MedianFilter
./MedianFilter

- Launch gdb in the terminal 3:
# needed for IGA (Intel Graphics Assembly) disassembly
#
source /opt/intel/opencl-sdk/gt_debugger_2016.0/bin/debuggervars.sh
# launch gdb in TUI mode
#
/opt/intel/opencl-sdk/gt_debugger_2016.0/bin/launch_gdb.sh --tui
# execute these commands on the gdb prompt
#
target remote :1234
# the first continue is always needed in order
# to reach the initial breakpoint of the kernel
#
continue
# disassemble the first instruction of the kernel
#
x/i $pc
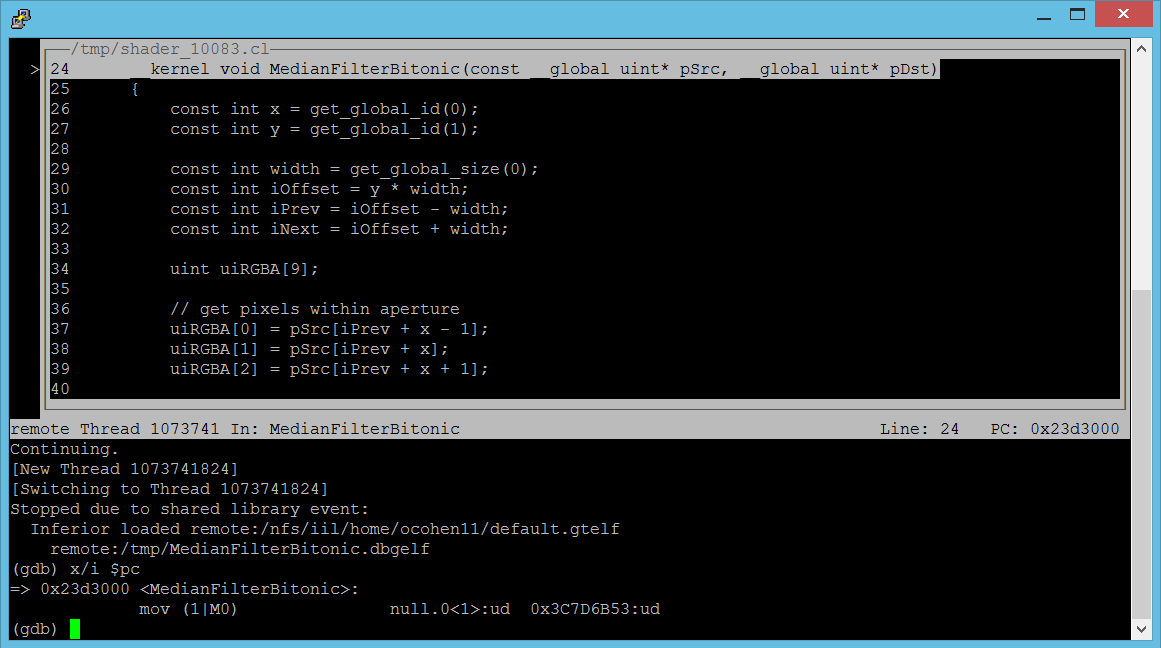
Now you stopped at the first instruction of the kernel (also called “the initial breakpoint”) and if all went well, you should see the following screen:

From this point you may use standard gdb commands to examine memory, set breakpoints, change run control, etc.
For example, set a breakpoint at line 52 and continue:
thread 2
break 52
continue
It should look like the following:
GDB* Cheat Sheet
Here is a GDB useful commands cheat sheet:
# Print/examine variables/memory
#
print pSrc – print the value of the pointer passed to the kernel
x/4xw pSrc – print 4 WORDs (32-bits, note that it’s a gdb WORD) in hexadecimal form
x/4xw 0x1000 – print 4 DWORDs starting in memory address 0x1000
# Modify buffer’s/memory contents
#
set pSrc[0]=0xdeadbeef – change the first element in the array to 0xdeadbeef
set *(unsigned int*)0x1000=0xdeadbeef – change the memory contents at address
                                        0x1000 to 0xdeadbeef
# Print the register file
#
info registers     – show the ARF (Architecture Register File) registers
info registers all – show all registers, GRF (General Register File) + ARF
p/x $r0.v8_int32[0] – show the first 32-bit of the r0 register, i.e. r0.0<8>:uw
set $r0.v8_int32[0]=0xdeadbeef – modify r0.0<8>:uw to 0xdeadbeef
# Breakpoints and run control
#
break 38         – set a breakpoint at line 38
continue         – continue execution (after gdb is stopped)
delete 1         – delete the first breakpoint
delete           - delete all breakpoints
info breakpoints – list all breakpoints
step             - step into function
stepi            - step one machine instruction
finish           - step out of current function
next             - step over current statement
# Thread control/info
# (you should ignore thread #0, as it’s a fake/dummy thread)
#
info threads – print all hardware (execution unit) threads
               note that on Gen hardware a HW thread is a SIMD thread that
               usually runs 8/16/32 OpenCL work-items
thread    – print the currently thread
thread 10 – switch the active thread to thread #10
# Disassembly
#
x/2i $pc – disassemble 2 instructions from the current program counter value
For more information on GDB commands, see the GDB manual.