Visible to Intel only — GUID: GUID-37F0CD80-9904-4CA2-8F21-D03C647255E1
Visible to Intel only — GUID: GUID-37F0CD80-9904-4CA2-8F21-D03C647255E1
Data View
The Data View enables visual displaying on a grid of all the OpenCL Memory Objects: Images, Buffers and SubBuffers, that were instantiated in the host application.
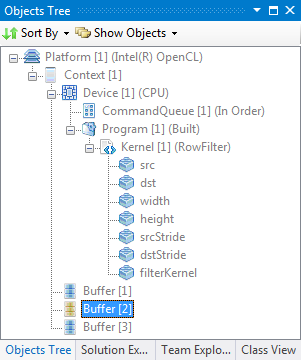
Each Memory Object is added to the Objects View, and by double-clicking Buffers/SubBuffers you can display the buffer contents, or by double-clicking an Image you can view the raw pixel data associated with the image.

Double-click the Buffer you need, and Data View window appears with the latest state of the buffer/sub-buffer.

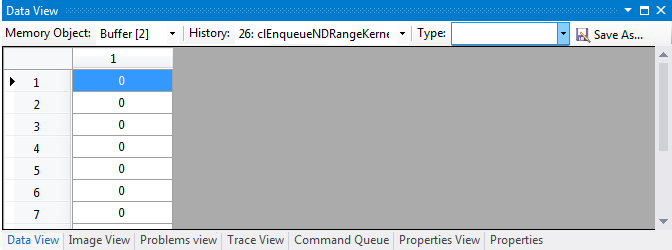
From the Memory Objects drop-down, select any memory object and the view shows the raw data associated with the object:
The history drop-down enables viewing various states of the selected memory object, where each state is a result of an API call.
Consider the situation of a host application that calculates a histogram of a grayscale image. For example, use a buffer with 256 bins for each color of the image, to calculate the histogram.
As a first step, issue an NDRange kernel called bzero to initialize the buffer with zeros:

Examine the buffer contents on the grid and see that all buffer elements are set to zero:

Now, as a second step, issue a second NDRange command that calculates the histogram of the image using the buffer as bins counter:

This example has 22 pixel elements with grayscale value 5, and 27 pixels with grayscale value 9, and so on.
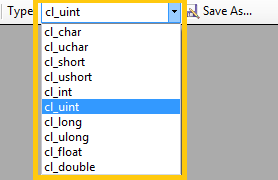
Use the Type box to select the underlying data type (for example, cl_uint, cl_double).

The Save As button enables saving a CSV representation of the data to disk.
When exporting Buffer/SubBuffer, you get each buffer cell in a separated line. The Buffer/SubBuffer values are interpreted as a contiguous memory chunk containing unsigned, chars as its elements.
When exporting an Image as a CSV, the number of rows in the output CSV is the height of the image (number of rows), and each row represents all columns of that row joined and delimited by commas.
The values in the cells are interpreted according to the image channel data type, so, for example, an Image that has CL_SIGNED_INT32 as its data-type, causes the resulting output to display each row as an array of signed 32-bit integers.
Each state is related to the API call that caused the change, and is in the following format: #ID: API Call.
Where #ID is the number of API call that caused the change, and API Call is the OpenCL API call that affected (changed) the object.
This is the same API call that it shown in the Trace View.
When selecting a memory object from the drop-down list, or alternatively selecting a memory object state, the Trace View automatically highlights the API call that is related to that state:

To configure the number of states to save per each memory object (Image, Buffers and SubBuffers) see Configuring the API Debugger