Visible to Intel only — GUID: GUID-2501FDF0-41F9-46BE-A6DA-E12818D4DBC9
Legal Information
Getting Help and Support
Introducing the Intel® SDK for OpenCL™ Applications
What's New in This Release
Which Version of the Intel® SDK for OpenCL™ Applications Should I Use?
Intel® Code Builder for OpenCL™ API Plug-in for Microsoft Visual Studio*
Intel® Code Builder for OpenCL™ API Plug-in for Eclipse*
Debugging OpenCL™ Kernels on GPU
Intel® SDK for OpenCL™ Applications Standalone Version
OpenCL™ 2.1 Development Environment
Intel® FPGA Emulation Platform for OpenCL™ Getting Started Guide
Troubleshooting Intel® SDK for OpenCL™ Applications Issues
Configuring Microsoft Visual Studio* IDE
Converting an Existing Project into an OpenCL™ Project
OpenCL™ New Project Wizard
Building an OpenCL™ Project
Using OpenCL™ Build Properties
Selecting a Target OpenCL™ Device
Generating and Viewing Assembly Code
Generating and Viewing LLVM Code
Generating Intermediate Program Binaries with Intel® Code Builder for OpenCL™ API Plug-in
Configuring OpenCL™ Build Options
Visible to Intel only — GUID: GUID-2501FDF0-41F9-46BE-A6DA-E12818D4DBC9
Creating and Launching a New Analyze Session
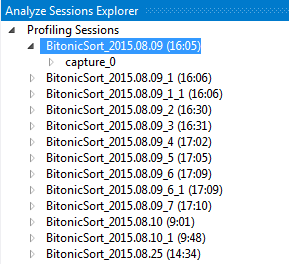
When you run the Code Analyzer, you create an Analyze Session, which contains the configuration data for collecting performance information and the results of the analysis run. You can explore the analysis sessions in the Analyze Sessions Explorer window.

To create and run an Analysis session, do the following:
- Go to Tools > Intel Code Builder for OpenCL API > OpenCL Application Analysis > New Analysis Session.... The OpenCL Application Analysis Session dialog box appears.
- In the Application Setting section, specify information about the application that you want to analyze:
- In the Application field, enter, or browse to, the full path and executable file name of the target application.
- In the Arguments field, enter the command-line options to use when launching the target application.
- In the Working Directory field, optionally enter the working directory for the target application. To use the directory specified in the Application field, check the Use application directory as working directory box.
- In the Session Name section, enter a meaningful name for the session.
- Verify that the Start Automatically on Process Launch check box is checked, and click Launch. Your application is launched and the Code Analyzer starts to collect data.
While the application is running, a new session run tab is opened in the main Visual Studio* window.
During the session, you can do the following:
- Click Pause/Resume analysis button in the session run tab to pause or resume data collection.
- Exercise the functionality that might cause performance issues.
- Click Close analysis to stop the analysis.