Visible to Intel only — GUID: GUID-6D4D2A81-ABBE-4F40-A835-5518EB87B107
Visible to Intel only — GUID: GUID-6D4D2A81-ABBE-4F40-A835-5518EB87B107
Targets in Virtualized Environments
Configure your system to use the Intel® VTune™ Profiler for targets running in such virtualization environments as Hyper-V* on Windows*, KVM* or VMWare ESXi* on Linux*, and others.
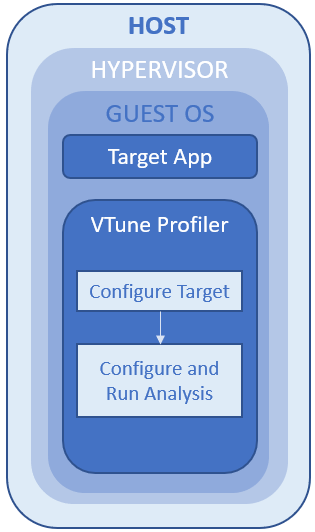
Virtual machines are made up of the following components:
Host operating system: system from which the virtual machine is accessed. Supported host systems: Linux*, Windows*
Virtual machine manager (VMM) or cloud service provider: tool used to access and manage the virtual machine.
Guest operating system: system accessed via the VMM and profiled using Intel VTune Profiler. Supported guest systems: Linux*, Windows*
In most cases, the VTune Profiler is installed on the guest operating system and analysis is run on the guest system. The guest system may not have full access to the system hardware to collect performance data. Analysis types that require access to system hardware, such as those that require uncore event counters, will not work on a virtual machine.
Typically the host operating system has access to the system hardware to collect performance data, but there are cases in which the host system may also be virtualized. If this is the case and you want to collect performance data on the host system, treat the host system as you would a guest system and assume that it no longer has the same level of access to the system hardware.

Analysis Type Support
Support for VTune Profiler analysis types varies depending upon which counters have been virtualized by the VMM. You can refer to the documentation for your VMM to get a list of virtualized counters.
If you run an analysis type that cannot be run in a virtualized environment, VTune Profiler displays a warning message.
VTune Profiler uses the two sampling-based collection modes for analysis:
-
In general, the Hotspots analysis type in this mode will work on every supported VMM because the analysis type does not require access to the system hardware.
-
Analysis types that use this mode (Hotspots and Microarchitecture Exploration) have limited reporting functionality. For example, they may not include accurate results for stacks because this data relies on information provided by precise events. Running analysis types that rely on precise events will return results, but the collected data will be incomplete or distorted. That is, the result may not point to the actual instruction that caused the event, which can be difficult to differentiate from correct events.
To enable performance analysis in the hardware event-based sampling mode on a virtual machine, additional configuration steps are required. As soon as you installed VTune Profiler, you need to enable the vPMU for your hypervisor:
Analysis types based on uncore events (Memory Access, Input and Output analysis, and others) and related performance metrics (Memory Bandwidth, PCIe Bandwidth, and others) are not supported on virtual machines.
Virtual Machine Host/Guest Support
A typical virtualized environment includes a host operating system, which boots first and from which the VMM is loaded, and virtual machines (VMs) running guest operating systems. There are multiple combinations of each and support varies based on each component.
Linux Host |
Windows Host |
|
Linux Guest |
KVM Hyper-V VMware |
VMware |
Windows Guest |
VMware |
VMware Hyper-V |
VTune Profiler supports profiling host and guest OS from the host system. This type of analysis is only available for virtual machines with KVM hypervisor as a preview feature.