Developer Guide
Intel oneAPI DPC++/C++ Compiler Handbook for Intel FPGAs
A newer version of this document is available. Customers should click here to go to the newest version.
Interpret Performance Counter Data
Profiling information helps in identifying poor memory or pipe behaviors that lead to unsatisfactory kernel performance.
The following sections explain the Profiler metrics that the Profiler reports record.
Stall, Occupancy, Bandwidth
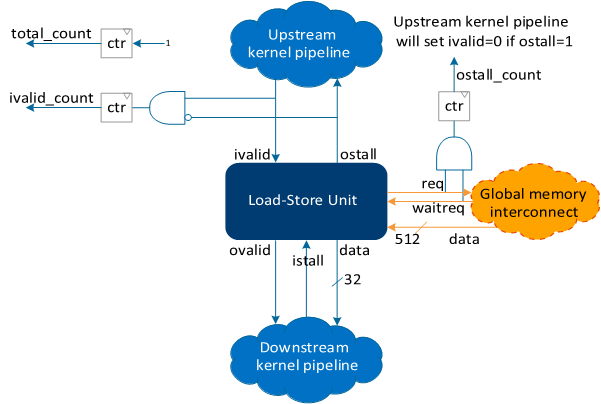
The CPU/FPGA Interaction View shows stall percentage, occupancy percentage, and average memory bandwidth for specific lines of kernel code. For definitions of stall, occupancy, data transfer size, and bandwidth, refer to Table 1.SYCL* generates a pipeline architecture where work-items traverse through the pipeline stages sequentially. For more information, refer to Pipelining.

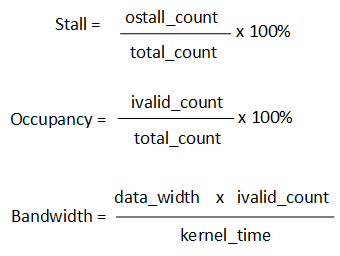
The following are simplified equations that describe how the Profiler calculates stall, occupancy, and bandwidth:

ivalid_count in the bandwidth equation also includes the predicate=true input to the load-store unit.
Ideal kernel pipeline conditions:
- Stall percentage equals 0%
- Occupancy percentage equals 100%
- Bandwidth equals the board's bandwidth
For a given location in the kernel pipeline, if the sum of the stall percentage and the occupancy percentage approximately equals 100%, the Profiler identifies the location as the stall source. If the stall percentage is low, the Profiler identifies the location as the victim of the stall.
The Profiler reports a high occupancy percentage if the compiler generates a highly efficient pipeline from your kernel, where work-items or iterations are moving through the pipeline stages without stalling. The following notes may be helpful when interpreting profiling data:
- If all LSUs are accessed the same number of times, they have the same occupancy value.
- If work-items cannot enter the pipeline consecutively, bubbles are inserted into the pipeline.
- In loop pipelining, loop-carried dependencies also form bubbles in the pipeline because of bubbles that exist between iterations. For more information about bubbles, refer to Occupancy.
- If an LSU is accessed less frequently than other LSUs, such as when an LSU is outside a loop that contains other LSUs, this LSU has a lower occupancy value than the other LSUs. This rule also applies to pipes.
Stalling Pipes
Pipes provide a point-to-point communication link between two kernels.
Stalls occur if there is an imbalance between the read and write sides of the pipe or if the read and write kernels are not running concurrently.
For example, if the kernel that reads is not launched concurrently with the kernel that writes, or if the read operations occur much slower than the write operations, the Profiler identifies a stall for the ProducerToConsumerPipe::write call in the write kernel.