Visible to Intel only — GUID: GUID-46D7BCD9-6476-4498-854C-6E0956CF8080
Visible to Intel only — GUID: GUID-46D7BCD9-6476-4498-854C-6E0956CF8080
Window: Offload Modeling Summary
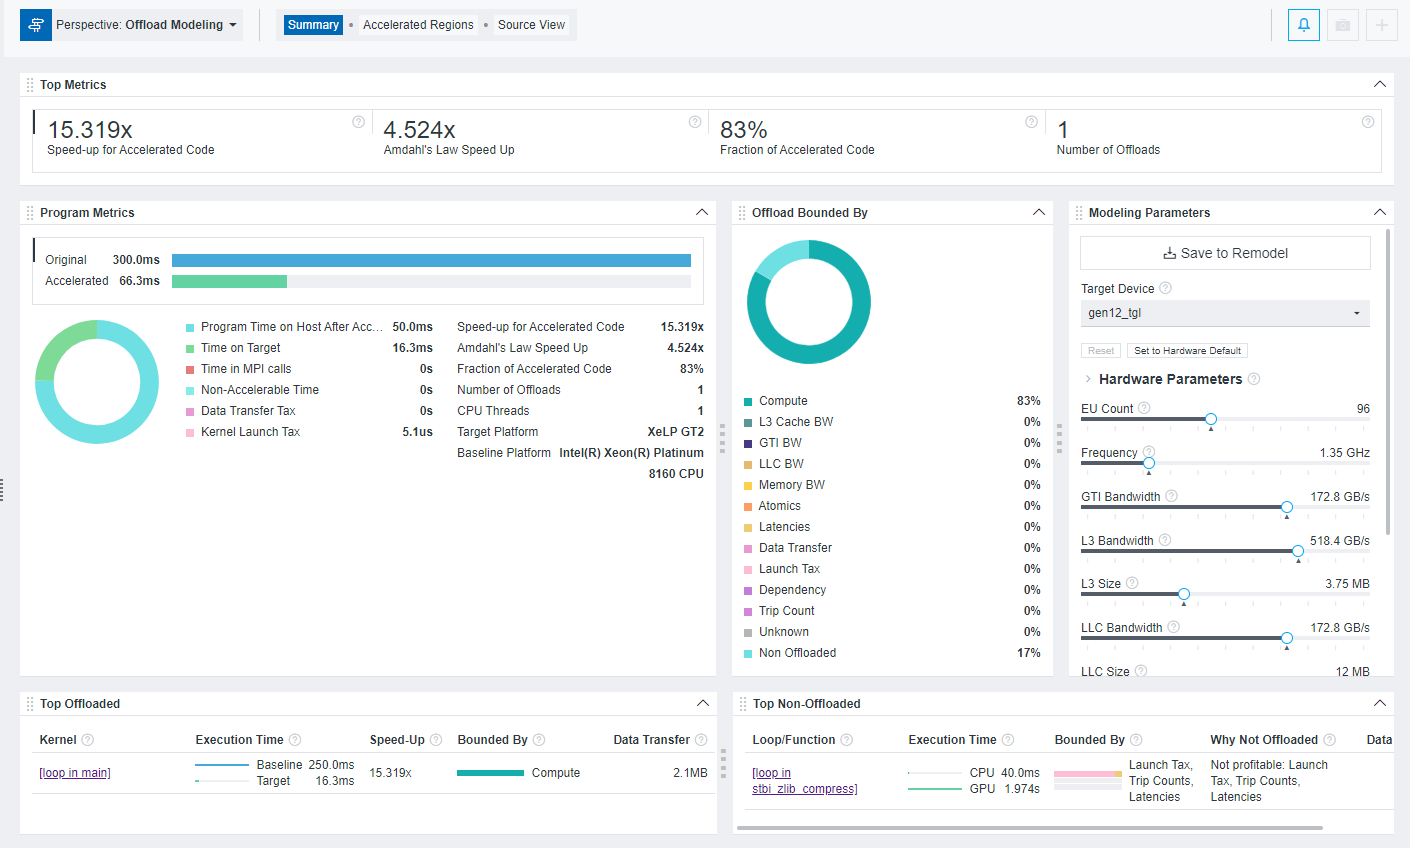
After running Offload Modeling perspective, use the Summary window to view the most important information about your code, total estimated speedup achieved from offloading, top offloaded and non-offloaded code regions, and more.
You can drag and drop, expand and collapse, and resize the panes to customize the Summary view to your needs.

Top Metrics
Use this pane to view information about estimated speedup of your code achieved by offloading. The following metrics are reported:
Speed-up for Accelerated Code |
Estimated speedup of your code in relation to its original execution time in pane |
Amdahl's Law Speed Up |
Estimated speedup for the whole application estimated by the Amdahl's law, which states that the potential speedup from parallelizing one part of a program is limited by the portion of the program that still runs serially. This metric is available only for the CPU-to-GPU modeling. |
Fraction of Accelerated Code |
Fraction of accelerated code, in per cent, relative to the total time of the original program. This metric is available only for the CPU-to-GPU modeling. |
Number of Offloads |
Number of offloaded code regions |
Program Metrics
This pane lists performance metrics estimated for the whole application, including original time before offloading and estimated time after offloading, break-down of estimated time spent on host and target devices, offload taxes, information about host and target platforms, and so on. This pane helps you to determine if your code is profitable to offload to a target device and compare time of original code before acceleration with estimated time of accelerated code.
Offload Bounded By
This pane lists the factors that prevent your code from achieving better performance on a target device. The information is shown in a list and in a pie chart that helps you visualize the results. The factor with the highest percentage indicates what you should optimize your application for on the target GPU to optimize its performance.
Modeling Parameters
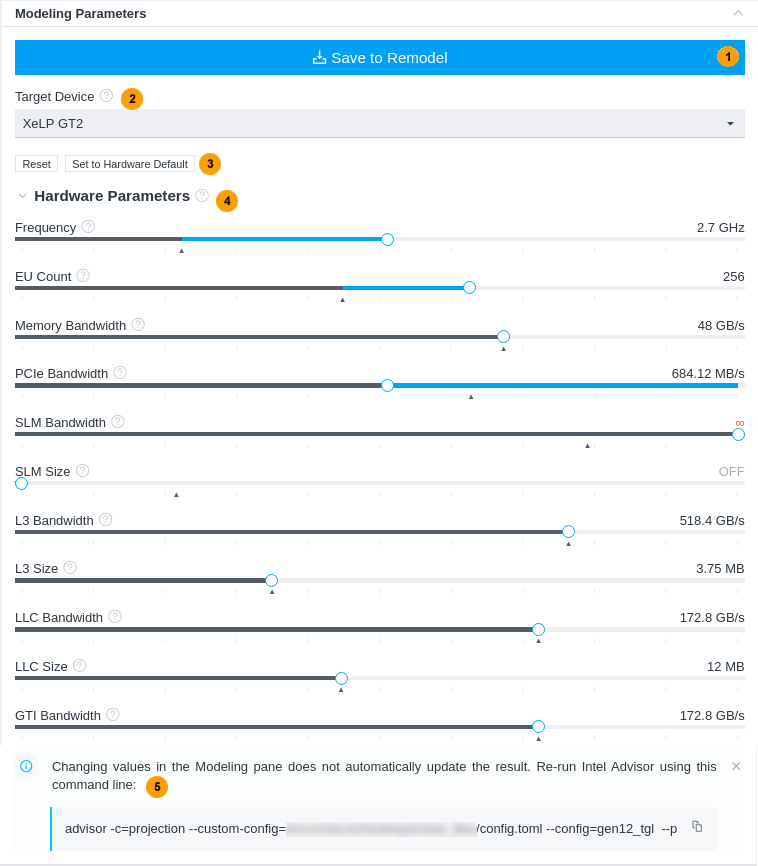
This pane shows the current modeled target GPU and its parameters. The pane is interactive, and you can use it to:
- Examine device parameters that the application performance was modeled on to understand how they affect the estimated performance.
- Change the target device to compare the selected device configuration with the current modeled device.
- Adjust the parameters using sliders and remodel performance for a new device to experiment with parameters and see how they affect the performance on the GPU.
The pane has the following functionality:

1 |
For CPU-to-GPU modeling in GUI and HTML report or for GPU-to-GPU modeling in HTML report: After you change the hardware parameters, click Save to Remodel to save the configuration file with your parameters and use it for remodeling. This does not update the modeling results automatically, but generates a configuration file with the device parameters you set. For GPU-to-GPU modeling in GUI report: After you change the hardware parameters, click the button to rerun the Performance Modeling analysis for the custom device. |
2 |
Select a target device for modeling to see its parameters and how they are different from the current device configuration. |
3 |
Click the Reset button to change the slider positions back to the parameters used for the current modeling. This button activates after you change any slider position. Click the Set to Hardware Default button to change the slider positions to the default target GPU parameters, for example, if your current modeled configuration is custom. |
4 |
Move the sliders to change the parameter to a desired value for a custom device configuration. Hover over the ? icon near the parameter name to learn more about it.
Notice that the parameter list might change depending on the target device selected. This might be due to differences between GPU architecture or terminology specifics. |
5 |
This is available only for CPU-to-GPU modeling in GUI and HTML report or for GPU-to-GPU modeling in HTML report. Copy the generated Performance Modeling command and run it from a terminal or a command prompt to remodel application performance for the custom target device. This command line is generated after you save the custom configuration with the Save to Remodel button. The command already includes all necessary options and paths to the configuration file and project directory and is ready for copy and paste. |
Top Offloaded
This pane lists the top five code regions that are the most profitable to offload to a target device with the following data per code region:
Loop/Function |
For CPU-to-GPU modeling only. Source locations of top five offloaded loops/functions with the highest speedup. Click a loop/function name to switch to the Accelerated Regions tab and view information about it in more detail. |
Kernel |
For GPU-to-GPU modeling only. Source locations of top five kernels with the highest speedup. Click a kernel name to switch to the Accelerated Regions tab and view information about it in more detail. |
Execution Time |
Elapsed time measured on a baseline device before offloading and elapsed time estimated on a target device after offloading. |
Speed-Up |
Estimated speedup the code region can achieve on a target device after offloading. |
Bounded By |
Main factor(s) preventing the code region from achieving better performance. Hover over the diagram to see bounded-by time for each factor. |
Data Transfer |
Data transfer overhead for the selected code region. |
Top Non-Offloaded
This pane lists the top five code regions not recommended for offloading to the current target device. This pane is available only if you run the CPU-to-GPU modeling and is empty for the GPU-to-GPU modeling as it assumes all kernels are offloaded ignoring their estimated speedup.
The pane shows the following data per code region:
Loop/Function |
Source locations of top five non-offloaded loops/functions. Click a loop/function name to switch to the Accelerated Regions tab and view information about it in more detail. |
Execution Time |
Elapsed time measured on a baseline device before offloading and elapsed time estimated on a target device after offloading. |
Speed-Up |
Main factor(s) preventing the code region from achieving better performance. Hover over the diagram to see bounded-by time for each factor. |
Bounded By |
Main factor(s) preventing the code region from achieving better performance. Hover over the diagram to see bounded-by time for each factor. |
Why Not Offloaded |
Reason(s) why the code region is not recommended for offloading to the current target device. Switch to the Accelerated Regions tab to get a more detailed explanation. |
Data Transfer |
Data transfer overhead for the selected code region. |