Visible to Intel only — GUID: GUID-C9F3BFB4-947C-4049-9489-0C47F1B87507
Visible to Intel only — GUID: GUID-C9F3BFB4-947C-4049-9489-0C47F1B87507
Menus
The menus in the menu bar have fixed components such as File, Edit and Help, and dynamic components such as Layouts, Analytics, and Trace Data Collection. The fixed components are always available, and the dynamic components may change depending on the plugins registered with the tool.

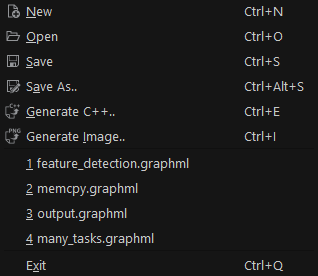
File menu: Allows you to create a new graph, load an existing graph, save the current graph on the canvas to a GraphML* file, or export it as C++ source files.

The menu also keeps a list of recently used files for quick access. Print support is currently unavailable. The Generate Image option enables printing the graph displayed in the canvas as a PNG file.
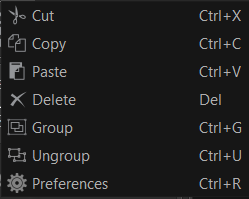
Edit menu: Allows you to edit the graph displayed on the canvas and supports common edit actions, such as Cut, Copy, Paste, Delete, Group, Ungroup, and Preferences. These actions support the common keyboard shortcuts.

Help menu: Allows you to switch to the What’s This? mode, which provides help information for various GUI elements. In this mode, you can click any GUI element that has supporting help information to view more information about the element and what it helps you accomplish.

You can also get into the What’s This? mode using the keyboard shortcut Shift+F1.
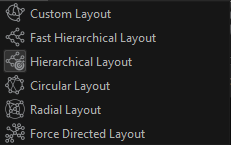
Layout menu: Allows you to visualize a graph on the canvas in different ways. Currently supported layout types are Hierarchical, Radial, Force-Directed, New Hierarchical, and Circular. For most graphs, the Hierarchical Layout is enough and is set as the default layout. If the Hierarchical Layout does not work properly for a graph model, you can use the New Hierarchical Layout.
NOTE:The New Hierarchical Layout is 3x slower than the default Hierarchical Layout.If you cannot get a visually pleasing layout using the hierarchical layouts, use the Radial, Circular, or Force-Directed layout. The Circular Layout and Force-Directed Layout use the Boost* Graph library. The cost of running the Force-Directed Layout is high compared to other layouts, but it provides better graph layout visuals.

Analytics menu: Allows you to choose an analytical algorithm from available plugins. This menu changes as new plugins are added.

These analytical algorithms are available for Intel® oneAPI Threading Building Blocks flow graphs. More algorithms may be added in the future.
Compute Critical Path computes one or more critical paths for a graph and lists them in the Analytics Report tab. You can interact with these critical paths to see which nodes are part of them.
Graph Rule-check performs basic rule checks on a graph and highlights potential performance and correctness problems.
Compute Modeling Projection projects the speedup of a graph with varying numbers of threads. The speedup with the corresponding number of threads is shown in the Analytics Reports window, while a chart showing the ideal versus actual speedup is shown in the chart area.