Visible to Intel only — GUID: aen1706642599125
Ixiasoft
1. Introduction to Agilex™ 5 FPGA Thermal Design Guidelines
2. Agilex™ 5 FPGA Mechanical Construction
3. Agilex™ 5 FPGA CTM Construction
4. Power and Thermal Calculator (PTC)
5. General FPGA Thermal Design Considerations
6. Design Examples
7. Heat Sinks
8. Document Revision History for the Thermal Design User Guide: Agilex™ 5 FPGAs
A. Agilex™ 5 FPGA Product Keys and Package Drawings
Visible to Intel only — GUID: aen1706642599125
Ixiasoft
6.2. Example 2: Solution with Temperature-Dependent Power
In Example 1, the analysis was based on the power dissipation for TJ=100° C; however, the cooling solution keeps the TJ at 96° C, meaning that the static power is lower and the total power dissipation is less than what was used in the analysis.
To get a more accurate result you must run an iterative analysis using a variable power for the FPGA as a function of temperature. To do this, you must enter the power of the FPGA as a function of the case temperature, TCASE, and enter it into your CFD analysis. You can run the PTC for several TJ-MAX values at 5° C increments and record the TCASE value for each increment. In this way you can build your power graph for CFD analysis. This method is particularly useful if the FPGA has high static power consumption, or if there are several FPGAs in your system with varied ΨCA.
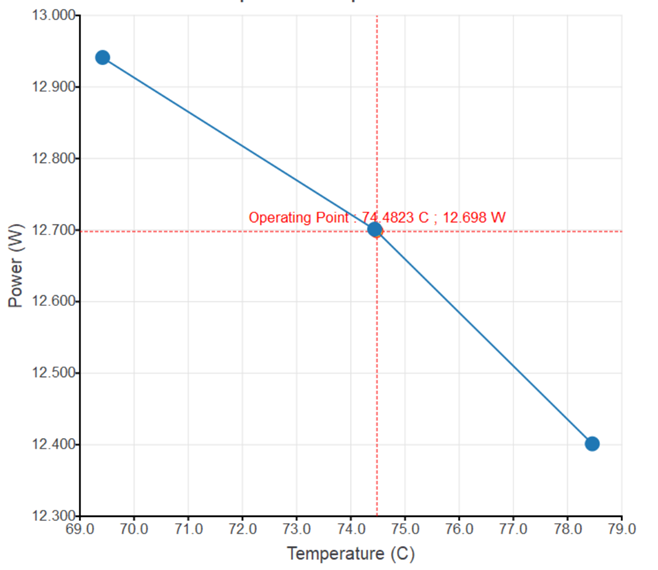
The following figure shows the power curve for this example. The power and TCASE values for this instance are obtained from the PTC by setting the TJ-MAX values to 100⁰ C, 95⁰ C, and 90⁰ C. The graph also shows the conversion point for the analysis, indicating a case temperature, TCASE, of 74.5⁰ C and thermal design power (TDP) of 12.7 W.
Figure 8. Temperature-Dependent Power Curve and Solution Conversion Point
The following equation illustrates the calculation of the new junction temperature, based on the new results:
TJ = TCASE + TDP * ѰJC
TJ = 74.4 + 12.7 * 1.617 = 95° C
These results show that the junction temperature drops by a degree; also notice that in the new calculation the value of ΨJC changed. As stated before, this value is not constant and for this case it corresponds to when the TJ-MAX entered in the PTC is 95° C.
Temperature-dependent calculations may not be necessary in all cases, however they are recommended for increased accuracy and when changes in static power can affect the result.