Intel® Integrated Performance Primitives (Intel® IPP) Developer Guide and Reference
A newer version of this document is available. Customers should click here to go to the newest version.
Image Quality Index
Intel IPP functions described in this section compute the universal image quality index [Wang02] that may be used as image and video quality distortion measure. It is mathematically defined by modeling the image distortion relative to the reference image as a combination of three factors: loss of correlation, luminance distortion, and contrast distortion.
If two images f and g are considered as a matrices with M column and N rows containing pixel values f[i,j], g[i,j], respectively (0 ≥ i > M, 0 ≥ j > N ), the universal image quality index Q may be calculated as a product of three components:

where


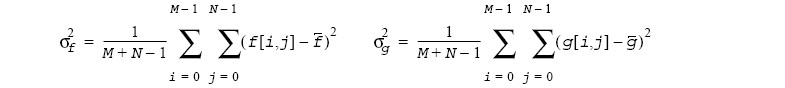
The first component is the correlation coefficient, which measures the degree of linear correlation between images f and g. It varies in the range [-1, 1]. The best value 1 is obtained when f and g are linearly related, which means that g[i,j] =af[ i,j]+b for all possible values of i and j. The second component, with a value range of [0, 1], measures how close the mean luminance is between images. Since σf and σg can be considered as estimates of the contrast of f and g, the third component measures how similar the contrasts of the images are. The value range for this component is also [0, 1].
The range of values for the index Q is [-1, 1]. The best value 1 is achieved if and only if the images are identical.
- QualityIndexGetBufferSize
Computes the size of the work buffer for the ippiQualityIndex function. - QualityIndex
Computes the universal image quality index.