Visible to Intel only — GUID: GUID-71E81754-B054-4789-B0D9-4D159ABE7B72
Visible to Intel only — GUID: GUID-71E81754-B054-4789-B0D9-4D159ABE7B72
Optimize Shaders
Review shader source code and assembly code with Graphics Frame Analyzer to identify inefficiencies in shader execution. Change the shader code inside Graphics Frame Analyzer and check the performance effect without recompiling your code.
- Check for shader bottlenecks
- Profile shader source code
- Analyze shader resources
- Profile shader assembly code
- Experiment with shader code
- Evaluate performance
- Evaluate final picture
Check for Shader Bottlenecks
Select a group of draw calls for analysis either using ![]() Advanced Profiling mode or choosing the calls that take more time on the GPU (
Advanced Profiling mode or choosing the calls that take more time on the GPU (![]() ).
).
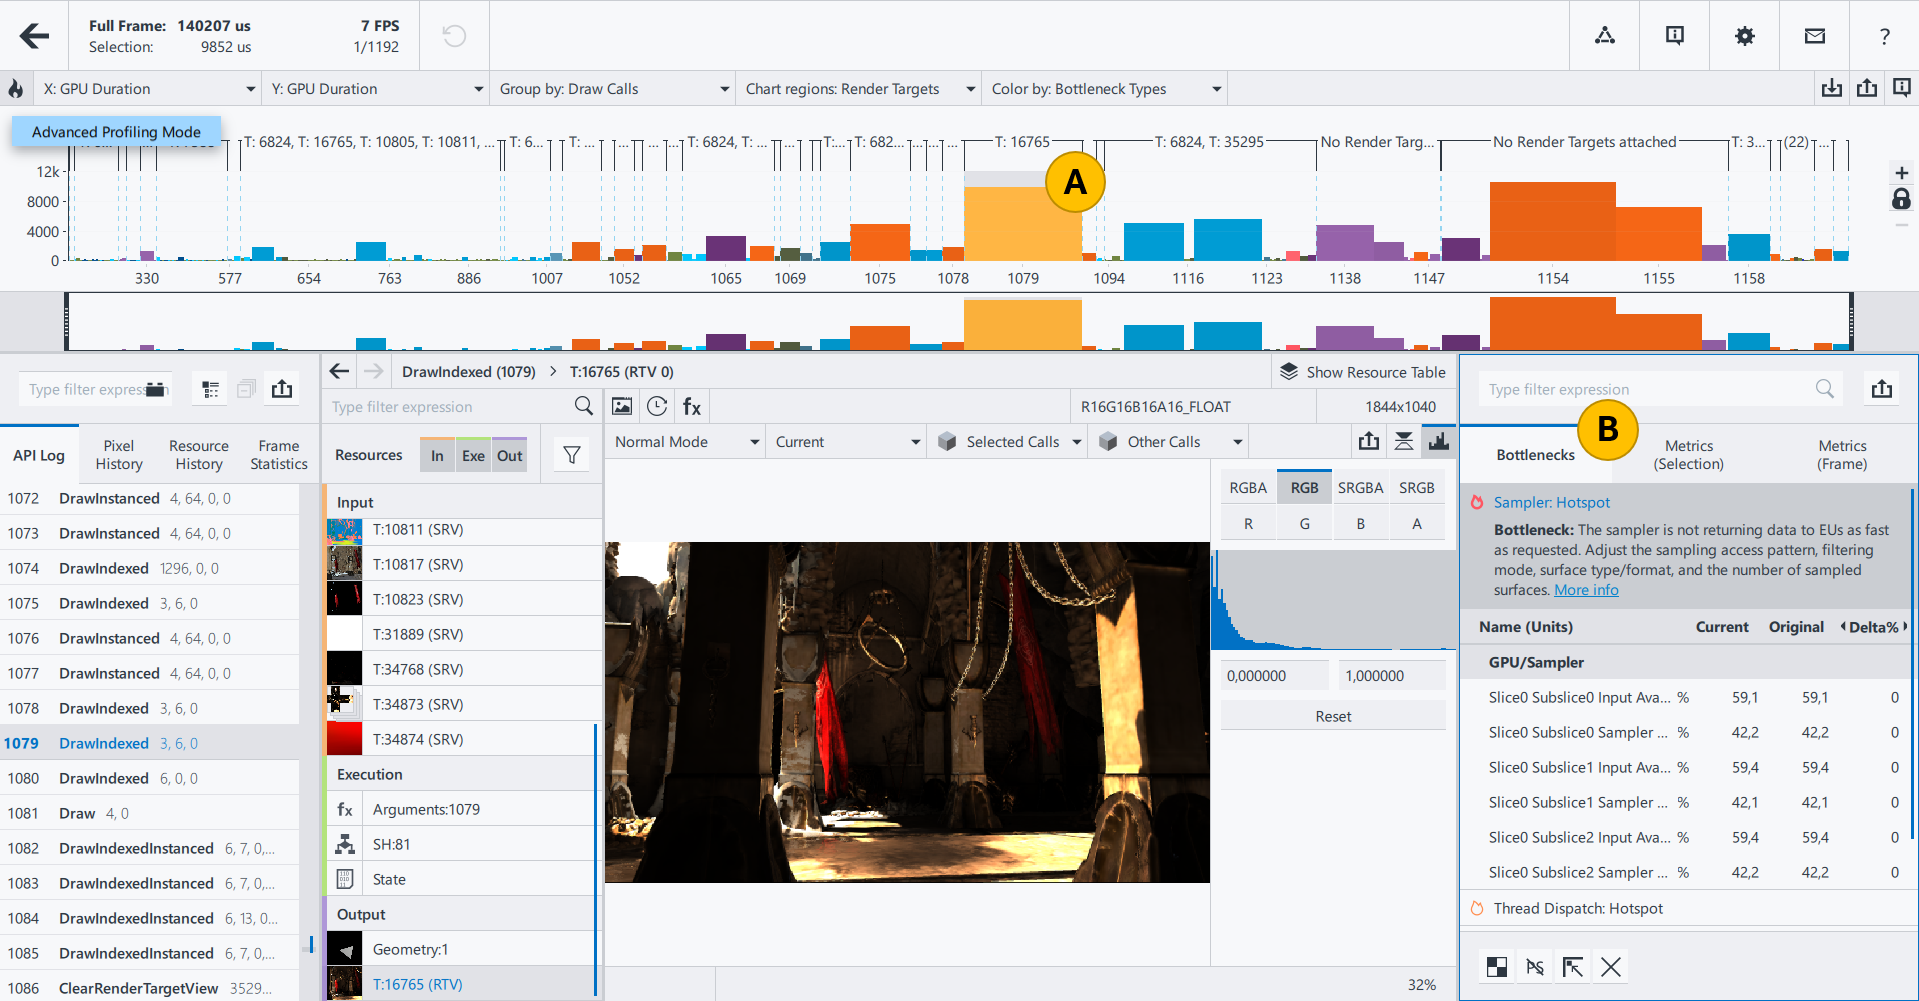
To determine whether shaders cause a performance bottleneck for the selected draw calls, refer to the Bottlenecks tab of the Metrics pane (![]() ). Shader algorithms may cause performance issues in various cases, but the main ones are the following:
). Shader algorithms may cause performance issues in various cases, but the main ones are the following:
 Shader Execution bottleneck is caused by shaders that perform complex computations and are executed many times. In most cases, the bottleneck is caused by pixel and compute shaders.
 In this case, EU Thread Occupancy and EU Active metrics are close to 100%.
To optimize the shader execution bottleneck, you can simplify a shader: reduce unnecessary computations in a shader code and avoid using complicated arithmetic functions.
 Sampler bottleneck appears when the sampler is not able to generate output data with the requested speed.
 In this case, there's a huge difference between Input Available and Sampler Output Ready metrics.
To optimize the sampler bottleneck, you can: identify which sampling instructions take more time, optimize inefficient functions by changing resource parameters (format, size, filter parameters), or reduce the amount of sampling.
 L3 bottleneck appears when graphics cache (L3) is not able read or write data with the requested speed.
 To optimize L3 bottleneck, you can reduce memory traffic or improve memory access patterns to Shared Local Memory (SLM), Unordered Access Views (UAV), textures, and constants.
This topic covers basic steps for shader profiling with Graphics Frame Analyzer. To get detailed solutions for bottlenecks, refer to Cookbook recipes Optimize Shader Execution and Optimize Sampler.
Profile Shader Source Code
- Once you selected draw calls for analysis, choose the shader used in these draw calls from the Resource List (
 ).
).
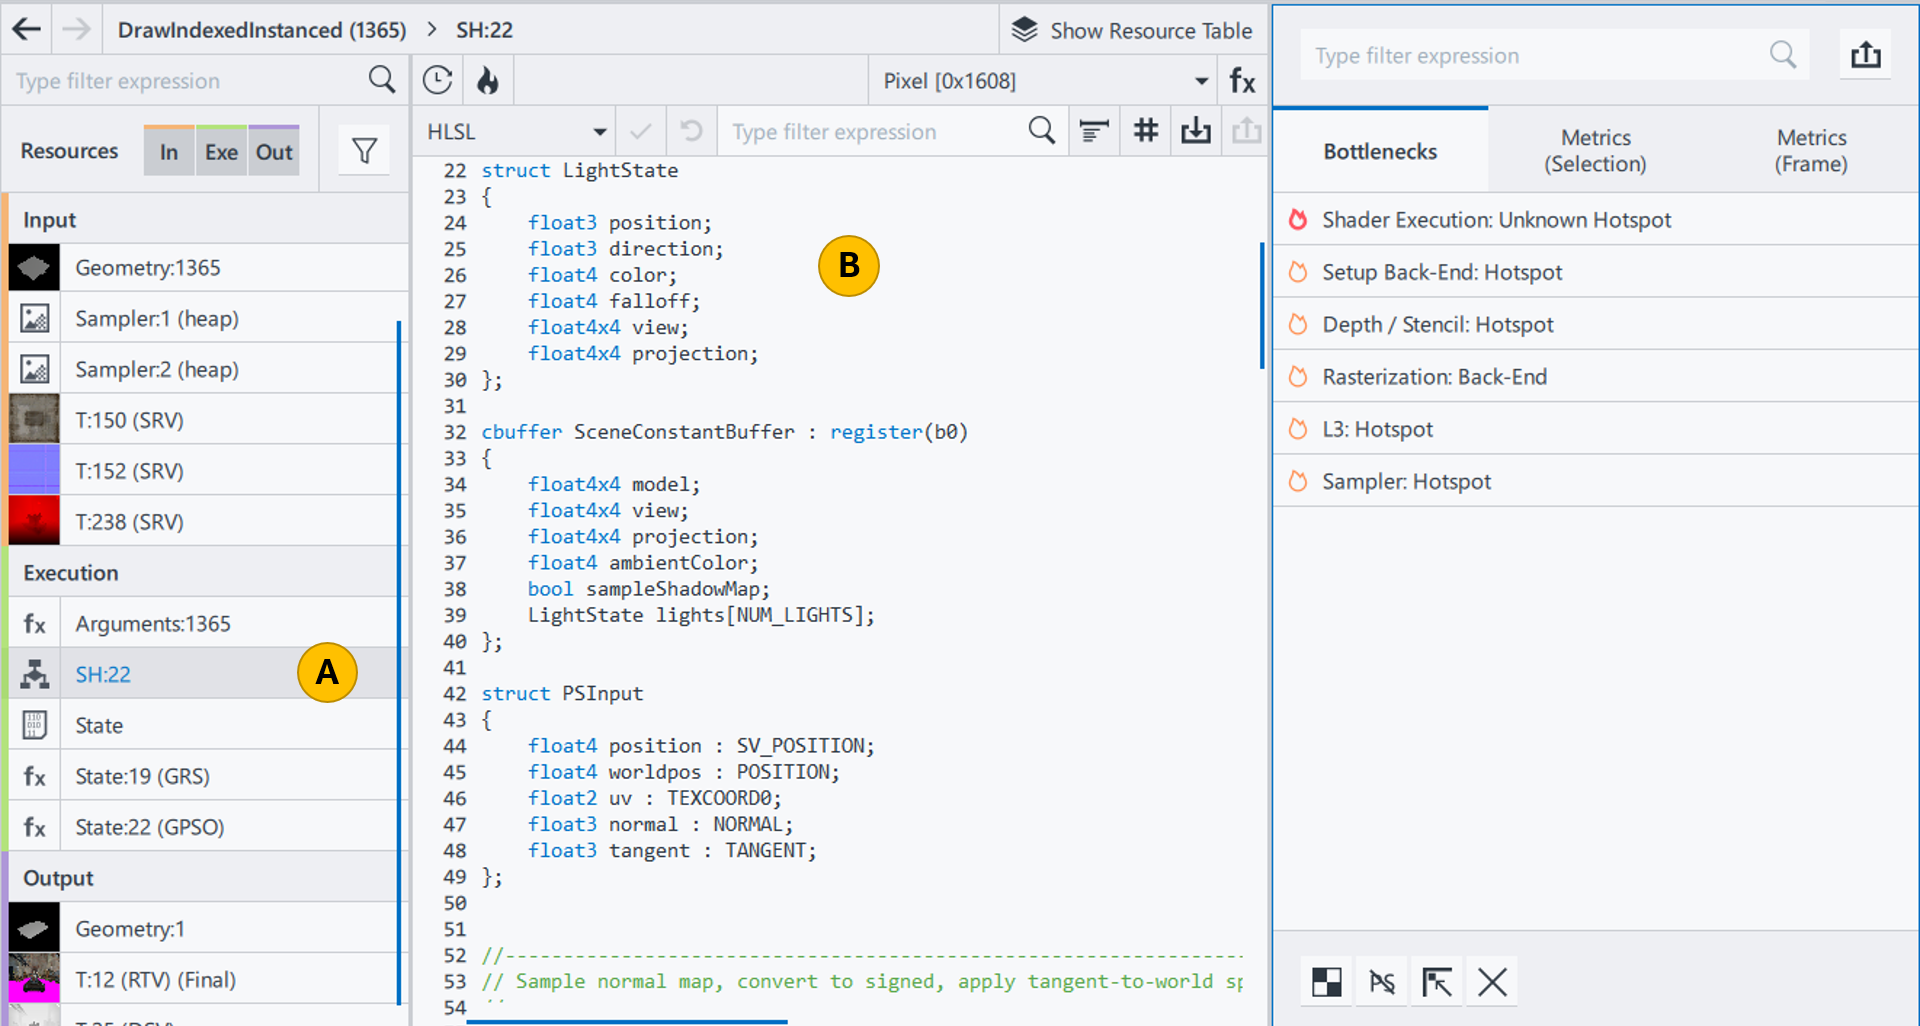
Graphics Frame Analyzer displays the shader source code in the Shader Editor (
 ).
). - From the Shader Type drop-down list on the top right (
 ), choose pixel or vertex shader for profiling.
 In most cases, the pixel shader is causing the bottleneck, but you can compare Shader Invocations (
 ) metrics to understand which shader was executed more times and needs optimization.

The shader code opens in the Shader Editor. For easier reading, you can click the
 button to indent the code, and the
  button to preprocess the selected shader and hide the code paths that do not get executed.
 - Click the
 Shader Profiler button to view performance data per shader code line.
 The shader viewer displays all generated versions of Gen ISA code in the drop-down menu on the top left (
 ), and the profiling data column on the left of the shader editor (
 ).
).

You can choose either duration or execution count to analyze the efficiency of your shaders (
 ).
). - Duration: shows the estimated portion of time a line of code took in percent, relative to the execution time of all shader stages.
- Execution Count: shows the total number of times the exact line of code was executed.
At this step, you need to understand which parts of code take more time. Stalls may occur, for example, due to inefficient use of resources or redundant calculations.
As a next step, you can:
- Analyze shader resources
- Profile shader assembly code
- If you already have assumptions about bottleneck root cause and possible improvements, experiment with shader code and evaluate the impact on performance.
Analyze Shader Resources
To inspect resources bound to the shader, open the Shader Resource List by clicking the ![]() button.
button.
In the Shader Resource List, resources used in the shaders are grouped by type:
- Render Target View (RTV)
- Sampler
- DirectX resources:
- Shader Resource View (SRV)
- Constant Buffer View (CBV)
- Unordered Access View (UAV)
- Vulkan resources:
- Access View (UAV)
- Storage Buffer Object (SBO)
- Storage Texture
- Texture
- Uniform Buffer Object (UBO)
- Vertex Buffer View (VBV)
Graphics Frame Analyzer displays resource parameters, the shader type using the resource, and shader registers each resource is bound to. Resources are listed in the following format: <resource name> <register ID> <resource type>:<resource ID> (<view type><view ID>) <resource debug name>. For example, cbPerObject b0 B:43 (CBV 1).
To open a resource, click the desired resource name from the Binding column.
Profile Shader Assembly Code
When optimization of shader algorithms reached its limits, you can step down to a low-level optimization and examine ISA shader code to use GPU resources more efficiently.
To view ISA instructions, select ISA from the drop-down menu on the top left. To view source-assembly mapping:
- Click the
 Shader Profiler button to view performance data per shader code line.
 - Click the
 Show source-assembly mapping button to view the source code and the assembly code side-by-side, and to map individual source or assembly lines to their counterparts.

Source-assembly mapping is available for shaders compiled with debugging information. To enable source-assembly mapping, you can:
- Compile a shader with debugging information in your application.
- For DirectX frames, apply any modification to a shader in Graphics Frame Analyzer and click the
 button. Your shader recompiles with debugging information directly in Graphics Frame Analyzer.
If you are new to Gen assembly profiling, refer to Introduction to GEN Assembly to learn how to interpret ISA code and understand register region syntax and semantics. To get detailed descriptions of Gen ISA instructions, refer to Intel® Iris® Xe Graphics Open Source Programmer's Reference Manual.
Experiment with Shader Code
You can experiment with the HLSL code for DirectX*, and HLSL and GLSL for Vulkan*, if they are available for your shader. Edit the shader directly in Graphics Frame Analyzer and evaluate the impact on visuals and performance in real time:
- Select HLSL or GLSL from the respective drop-down menu and edit the code in the Shader Editor.
The shader recompiles on the fly. If you introduced any errors, you can see the corresponding message in the Notification pane below the Shader Editor.
- Click the
 button to save the changes.
 Graphics Frame Analyzer recalculates all metrics and displays new data in the Metrics pane and in the Main bar chart.
NOTE:When you click the button, Graphics Frame Analyzer saves all the shaders. This enables you to write your own code and replace the whole shader to experiment.
- If you want to undo your edits, click the
 button.
 The original shaders are restored.
Evaluate Performance
After you apply changes, metrics change automatically.
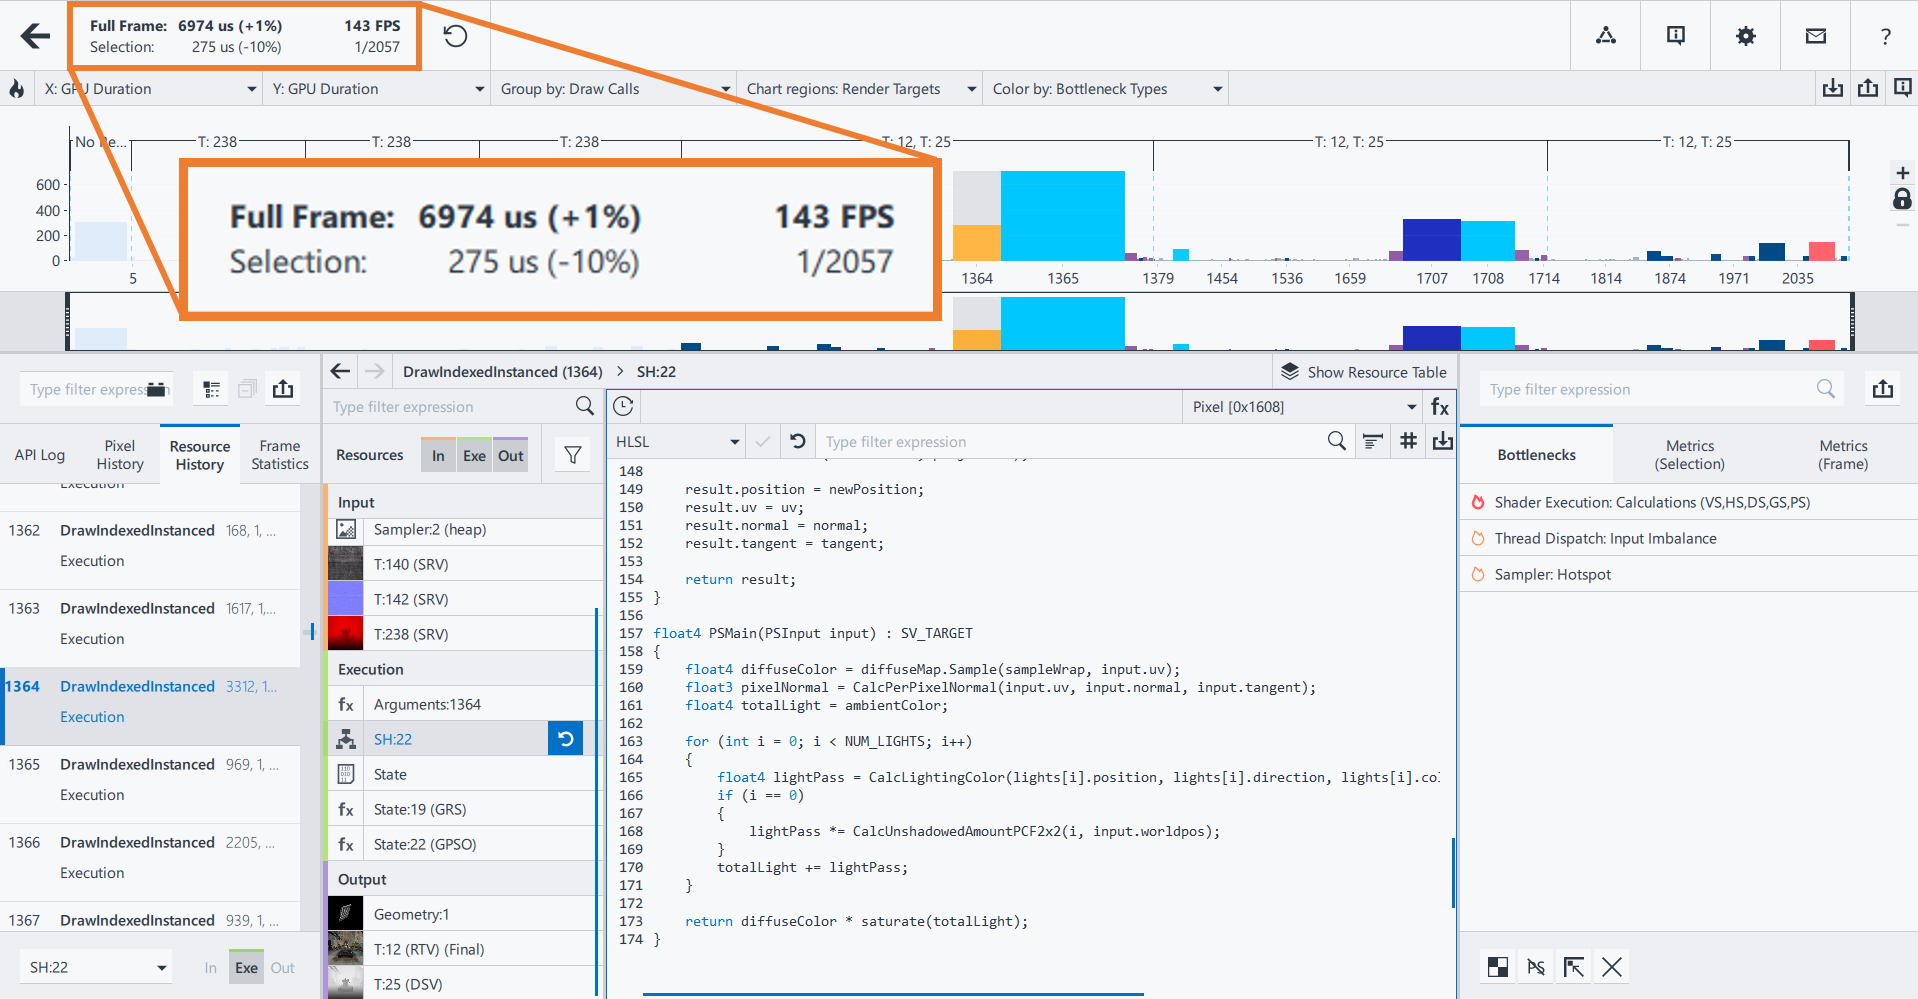
See how time spent on selected draw calls changes on the top left of the Profiling View window. The difference between current and original states is shown in braces.
Evaluate Final Picture
To see how the render target changes, open the render target view (RTV) resource from the resource list.
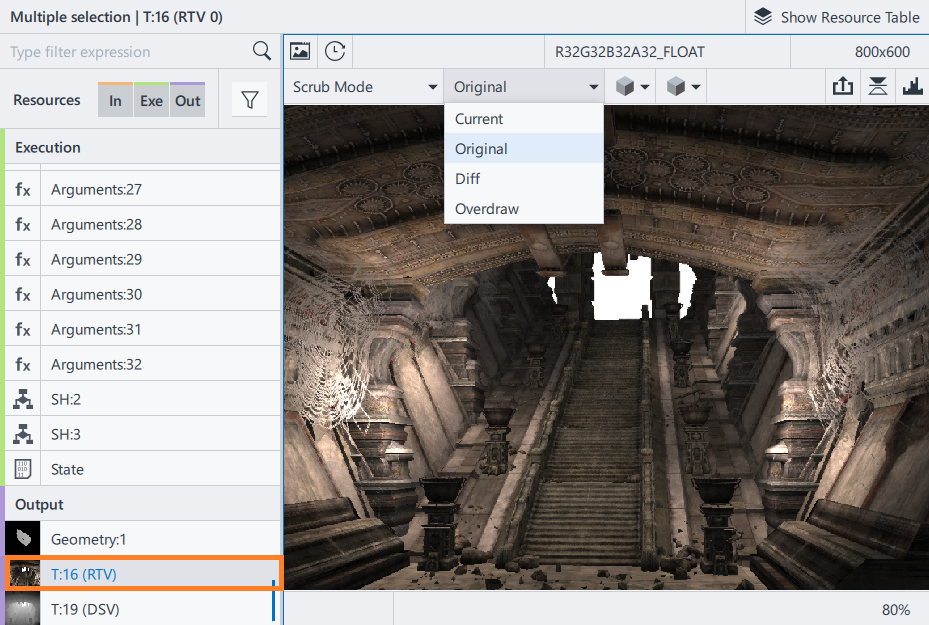
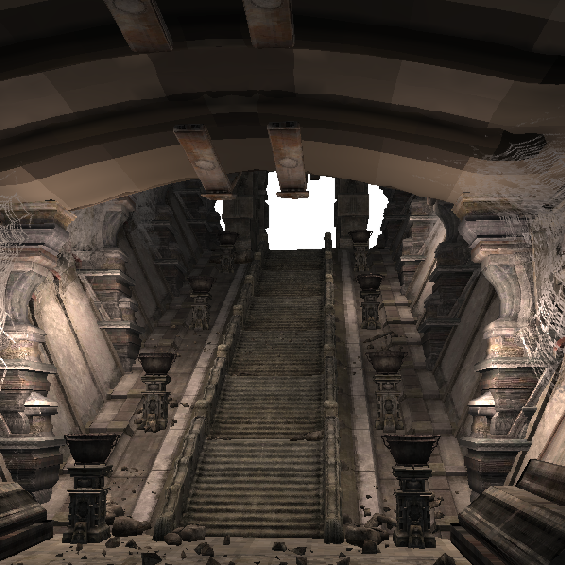
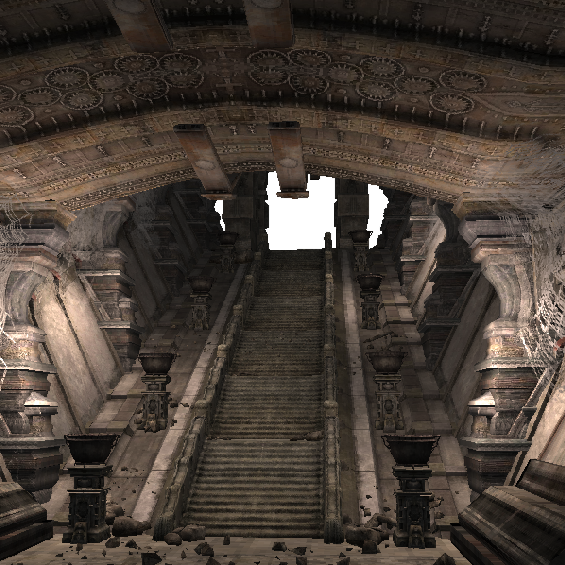
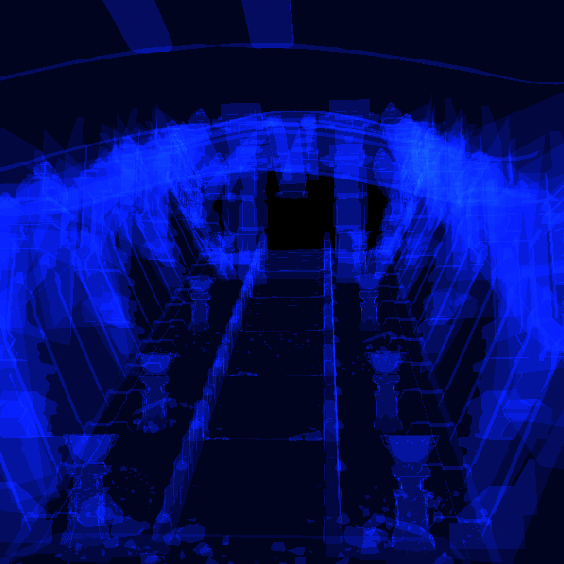
To compare a new render target version and the original one, choose one of the modes from the Output Texture Visualization Mode drop-down list:
| Current | Original | Diff | Overdraw |
|---|---|---|---|
| Shows the render target with modifications. | Shows the render target without modifications. | Shows the difference between the current and the original mode. | Shows the render target with an overdraw visualization. |
 |
 |
 |
 |
- For DirectX* 11 shaders without debug information, DXBC-ISA mapping is available instead of HLSL-ISA mapping.
- Source-assembly mapping is not supported for Shader Model 5 shaders on DirectX* 12 applications. To enable it, recompile the shaders for Shared Model 6.
- Shader Profiler requires Intel® Graphics Driver version 26.20.100.7755 or higher.
- This feature is supported on 9th Generation (code names Skylake, Coffee Lake, Kaby Lake), and 11th Generation (codenamed Ice Lake) Intel® Graphics hardware.