A newer version of this document is available. Customers should click here to go to the newest version.
Visible to Intel only — GUID: GUID-619B34D2-0236-4EE6-B32B-A2D500C42A15
Visible to Intel only — GUID: GUID-619B34D2-0236-4EE6-B32B-A2D500C42A15
Heads-Up Display (HUD) UI Reference
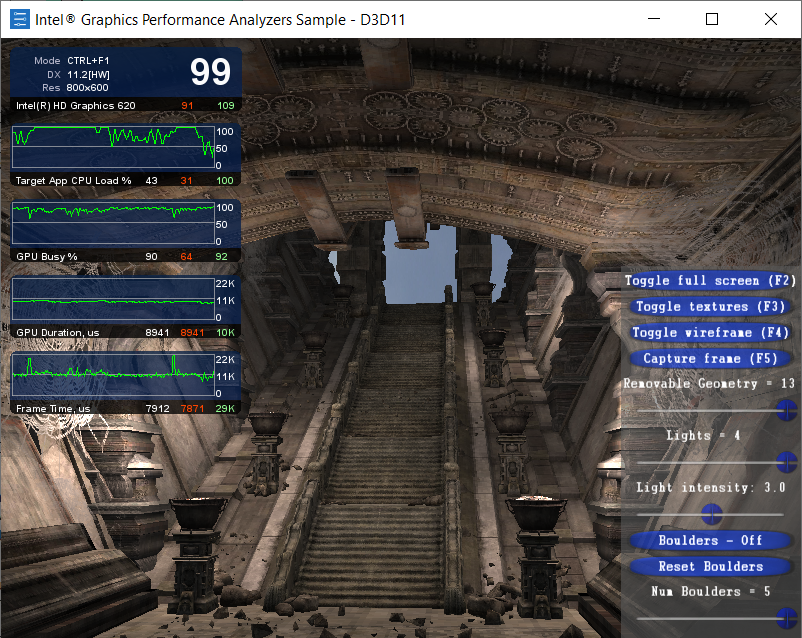
This section provides reference on the UI elements of the Heads-Up Display (HUD), which is an overlay provided at the top left of the screen when you launch the application.
HUD displays system and application statistics on application performance using the GPU and CPU performance metrics selected in the Graphics Monitor Options dialog box.
When you create trace or frame capture files, HUD displays the following information:

| System Information pane System Information includes the following information:
|
|
| FPS pane FPS (Frames Per Second) - frame rate, with lowest value shown in red (51) and the highest shown in green (76); the instantaneous value (73) is calculated for one second. |
|
| Messages pane Status messages are displayed when you create trace or stream capture files. Possible messages are the following:
On the Messages pane, you can also see the tips on keyboard shortcuts. With the HUD default keyboard shortcuts you can capture frame and trace files, pause and resume the application, and switch between HUD modes. |
Metrics Charts
When you create frame capture files, HUD displays four metrics charts.

For Intel® HD Graphics 3000/2000 and Intel® HD Graphics GPUs, the Heads-Up Display provides several kinds of data:
- CPU data
- DirectX* version
- GPU data:
- Execution Units
- Geometry Shader Input-Assembler
- Main
- Memory
- Output-Merger
- Pixel Shader
- Rasterizer
- Texture Sampler
- Vertex Shader
For non-Intel GPUs and Intel GPUs prior to Intel® HD Graphics, the HUD displays the following data:
- CPU
- DirectX* version
Metrics are displayed in the form of sparklines and include the following data:
- Metrics name
- Instantaneous values (white)
- Minimum metrics values (red)
- Maximum metrics values (green)
The minimum and maximum values reflect the min/max during the last seven seconds.
Limitations
The HUD may make available only the default set of metrics that it provides on non-Intel GPUs, even when using Intel® HD Graphics, in the following cases:
- On non-Intel GPUs and on older Intel GPUs such as Intel® GMA 4500/X4500/X4500HD/4500MHD, only the default set of metrics is available
- The application is using the Microsoft DirectX* 11 API, but is forcing it to use feature level 9. This is also known as DX11-on-9 mode.
- The application is using the WARP rasterization (Windows* Advanced Rasterization Platform).
HUD Default Keyboard-Shortcut Assignments
Some games might be using a particular keyboard-shortcut combination. If a default keyboard shortcut does not appear to be working with your game, you can assign new keyboard shortcuts. For information on how to assign a different capture keyboard shortcut, refer to Customize Keyboard Shortcuts.
With the keyboard shortcuts you can capture frame and trace files, pause and resume the application, and switch between HUD modes.
Some games and applications trap all keystrokes, so keyboard shortcuts within the Intel® GPA do not work. In this case, to create frame/trace capture files you can:
- Use Capture Frame/Capture Trace buttons of the System Analyzer.
- Use Triggers tab of the Options dialog box in the Graphics Monitor to automatically create frame/trace capture files when certain conditions occur, for example when FPS is 20.
| Frame Capture | Ctrl+Shift+C |
| Toggle Play/Pause | Ctrl+Shift+P |
| Trace Capture | Ctrl+Shift+T |
| Change Display Mode | Ctrl+F1 |
| Change Profiled DX Device (DirectX* 11 only) | Ctrl+F5 |
| Change HUD Location | Ctrl+F6 |