A newer version of this document is available. Customers should click here to go to the newest version.
Visible to Intel only — GUID: GUID-3C13C890-E8A2-46E0-A44E-2AF44BA511D9
Introduction to Intel® Graphics Performance Analyzers
Game Optimization Methodology
Install and Launch Intel® GPA
Enable System-wide Time-based GPU Metrics and Enable Query-based Metrics for OpenGL* in Graphics Frame Analyzer for Ubuntu*
Launch Application for Analysis
Configure Analysis Settings
Quick Start with Profiling Unreal Engine* Games
Analyze Desktop Graphics Applications
Instrumentation and Tracing Technology API Support
Intel® GPA Reference
Notices and Disclaimers
Visible to Intel only — GUID: GUID-3C13C890-E8A2-46E0-A44E-2AF44BA511D9
Optimize Graphic API States
With Graphics Frame Analyzer you can analyze graphics API states used in the captured frame:
- Graphics pipeline states used by draw calls. You can modify these states directly in the Graphics Frame Analyzer and see how these modifications might improve your application performance.
- Compute pipeline states used by dispatch calls. You can view these states in the Resource Viewer.
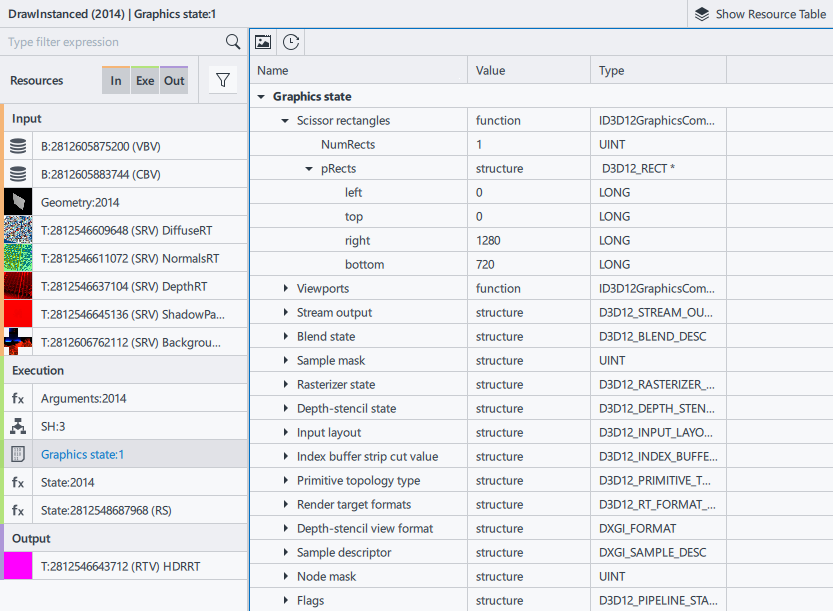
For frames opened from stream files, Graphics Frame Analyzer provides a combined state view that unifies both Pipeline State Object (PSO) and non-PSO states:

To experiment with graphics pipeline states:
- Select a draw call in the Main bar chart. The Resource Viewer is updated to display all resources used by the selected draw call.
- From the Resource List, choose the state to experiment with.
- Edit one or more states. Depending on the state type, use one of the following methods:
- Use ON/OFF toggle buttons to enable/disable state groups.
- Enter new values to modify numeric scalars, vectors, and bitmask values. If you enter an invalid value, the Graphics Frame Analyzer highlights it in red.
- Click the parameter to toggle between true/false, values or select a new value from the drop-down list with predefined values that conform to the graphics API specification.
 button that appears in the group title to which the modified states belong. If you want to revert all changes at once, click the
  button in the Resource Viewer.