A newer version of this document is available. Customers should click here to go to the newest version.
Visible to Intel only — GUID: GUID-756FA574-543B-45C5-A829-61943CC7202E
Visible to Intel only — GUID: GUID-756FA574-543B-45C5-A829-61943CC7202E
Graphics Frame Analyzer Window: Multiframe View
To access the Multiframe View window, select a stream for analysis in the Open Frame Capture window, and then click Open, or double-click on a stream preview.
- Multiframe View is available for Vulkan, DirectX 11 (preview) and DirectX 12 applications.
- Stream capturing is not supported on Linux* OS.

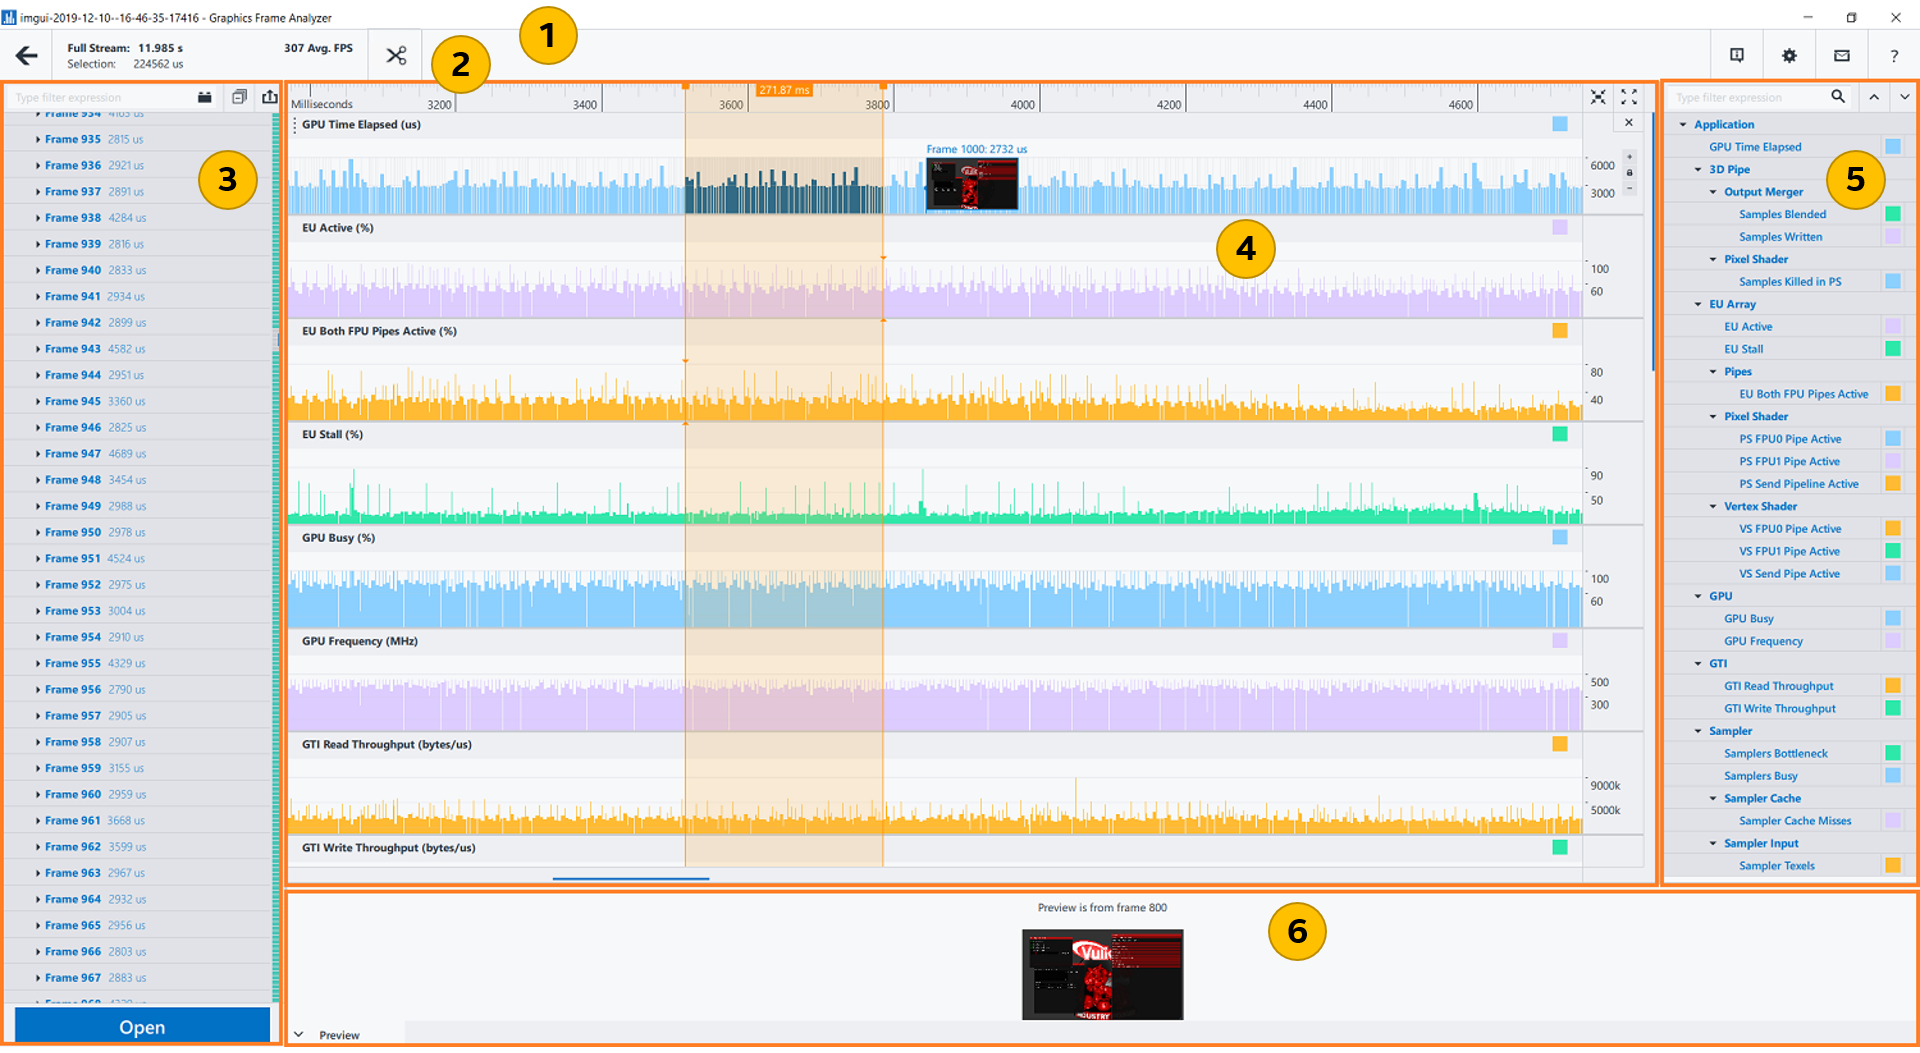
| Stream Title bar Displays the opened stream file name. The file name consists of the application name, capture date and time in the following format: YYYY_MM_DD_HH_MM_SS. |
|
| Main toolbar Displays the opened stream data, notifications, shows software and hardware information, provides access to general and appearance settings, restores the default view, contains Feedback and Intel® GPA User Guide buttons. |
|
| Stream Content pane Shows frames within the opened stream. |
|
| Stream Viewer pane Visualizes stream metrics data, zooms to the selection and zooms out. |
|
| Metrics pane Shows metrics collected for the opened stream - you can choose which ones to show on the Stream Viewer pane. |
|
| Preview pane Displays screenshots captured for the opened stream. To disable or enable screenshot capturing, go to the Graphics Monitor OptionsStream tab.
NOTE:
"No preview is available for current selection" message may appear for the first frames, if you turn on the Create screenshot every X frame/millisecond toggle buttons in Graphics Monitor Options.
|
Main Toolbar
Return to the Open Frame Capture window. |
|
| Stream Overview pane | Get statistics for the opened stream:
|
Сut the selected frames from the stream and save them into a new stream. This can be useful when a long stream only contains a few frames of interest. Trimming such a stream can save both disk space and processing time. Enable the Multi-Frame Profiling View (DirectX Tech Preview) toggle in Settings to enable the Trim Stream button. |
|
| Message pane | See messages and non-critical errors, if there are any.
NOTE:
If more than one message is open, use the Up or Down arrows to navigate between messages.
|
|
|
 Send feedback button Send feedback button |
Send feedback to the Intel® GPA technical support. |
 Help button Help button |
Open the Intel® GPA online documentation. |
Stream Content Pane
| Type Filter Expression field | Filter frames by number or duration. Save previous search keywords. You can use the Type Filter Expression field to find specific frames by running Graphics Frame Analyzer plugins. |
 Graphics Frame Analyzer plugins button Graphics Frame Analyzer plugins button |
Open the list of the available Graphics Frame Analyzer plugins, which help you to find specific frames. For example, Frame Search Assistant plugin searches for a frame of the specified duration. |
Close all the groups of events and commands for each frame in the Frame List tab, if available. |
|
Save the frame log in CSV format. You can also save the Frame log by pressing Ctrl+S. |
|
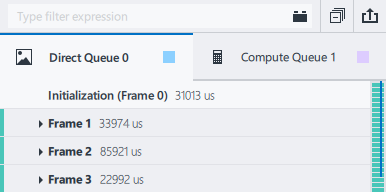
| Frame List tab | Get the list of frames of one rendering context/queue in the CPU execution order. The number of Frame List tabs depends on the number of rendering contexts/queues in the opened stream. To profile an individual frame, double-click the required frame; or click the required frame, and then click Open.
NOTE:
The first frame in a stream cannot be opened for profiling.
For Vulkan-based application streams, the Multiframe View shows subframes:
For applications based on Microsoft DirectX* 12 that use several command queues, the frame list shows each queue in a different tab:
For DirectX 12 applications with command queues that are instrumented with events, each frame can be expanded to view individual events and their details:
|
| Open button | Open the selected frame in the Profiling View window. For Vulkan-based applications, you can select several frames and subframes. |
Stream Viewer Pane
| Time line ruler | Correlate all the displayed frames with the time line. The range of the time line corresponds to the length of the stream in the current zoom level. Depending on the zoom-in level, the time intervals are displayed in seconds, milliseconds, microseconds, or nanoseconds. |
 Zoom to Selection button Zoom to Selection button |
Zoom into the time range of selected frames. |
 Restore zoom level button Restore zoom level button |
Restore the default zoom level. |
| Context/Queue bar chart | Visualize individual frames, their contribution to the overall stream time in the CPU execution order, and keyframes. Keyframe is a saved state of an application, from which you can play back the captured stream.
Bars for selected frames are highlighted on the Context/Queue bar chart. If you only select a part of a frame, the corresponding bar is hatched. Keyframes are shaded grey. By default, streams are visualized on the GPU Time Elapsed track. You can visualize other GPU metrics by selecting a sampling interval other than Frame in the Metrics tab of the Graphics Monitor Options before you start an application on Stream mode. When you set a sampling interval other than Frame, metrics are collected system-wide with the chosen frequency. For DirectX 12, calls from the queues are also shown on the bar chart, represented as markers with downward-pointing triangles. Each marker represents a point in time when a certain call was made. All markers extend downwards, which enables you to correlate calls to the overall frame and GPU metrics, such as GPU Busy (%).
You can also click on each call from the Frame List tab to highlight the corresponding frame and marker on the bar chart. |
| Individual chart controls | Change the vertical scaling of the bar chart by increasing or decreasing the relative height of the bars using the  or or  buttons respectively. By default, all bars are displayed in their original height. buttons respectively. By default, all bars are displayed in their original height. To enable or disable the vertical auto-scaling, click the |
Metrics Pane
| Type Filter Expression field | Filter stream file tracks by name or parameters. Save previous search keywords. |
 Collapse All Groups button |
Close all unfolded track groups. |
 Expand All Groups button |
Unfold all track groups. |
Metrics list |
See the list of metrics collected for the captured stream file. Click tracks from the Metrics to add them to the Stream Viewer.
NOTE:
To change track color or event color in the Stream Viewer, use the Track Color Modification button (the colored square to the right of the metric).
|


 /
/  toggle button. By default, the vertical auto-scaling is enabled.