A newer version of this document is available. Customers should click here to go to the newest version.
Visible to Intel only — GUID: GUID-EB06BB4D-DA12-4AE6-BE55-3828E860508B
Visible to Intel only — GUID: GUID-EB06BB4D-DA12-4AE6-BE55-3828E860508B
API Log Pane
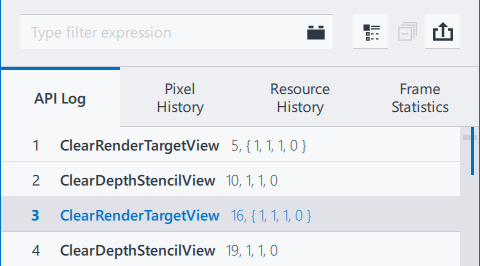
The API Log pane consists of the following items:
- API Log toolbar
- API Log tab
- Pixel History tab
- Resource History tab
- Frame Statistics tab

API Log Toolbar

Use the API Log toolbar to manage the API Log pane:
- Type Filter Expression field filters graphics API functions by name or parameters. Saves previous search keywords. You can use the Type Filter Expression field to find specific events by running
 Graphics Frame Analyzer plugins.
  Full API Log button displays in the API Log tab all functions used in the frame, in the call order.
NOTE:By default, the API Log tab shows only graphics API functions that produce any GPU activity, such as draw calls or clear calls. These graphics API functions are also called "events".
 Collapse All Groups button closes all the groups in the API Log tab, if available.
  ExportAPI Log button saves the API log in CSV format. You can also save the API log by pressing Ctrl+S.
API Log Tab
Use the API Log tab to do the following:
- Review the list of all functions, in the GPU execution order
- Review parameters passed to each function
- Create custom regions
- To facilitate debugging, you can specify object labels for various resources in your application, such as textures, buffers, shaders, by using special functions of graphics APIs.
- Graphics Frame Analyzer displays object labels in the API Log pane and Resources pane.
When you select an event in the Main bar chart, Graphics Frame Analyzer highlights the corresponding functions in the API Log tabs. For easier navigation, Graphics Frame Analyzer marks the functions that require your attention with colored bars. You can click the bar to navigate directly to the marked function:
- Green bars denote user-defined markers inserted in the application code or regions with the same render target or shader sets. Grouping can be selected using the Group By drop-down button on the Visualization Settings toolbar.
- (OpenGL-specific) Orange bars denote functions that caused warnings.
- (OpenGL-specific) Red bars denote functions that caused errors.
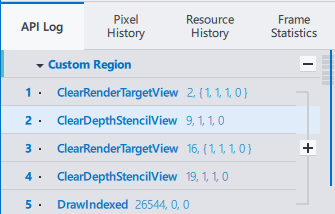
To create a custom region, do the following:
- In the Graphics Frame Analyzer Main toolbar, select Custom Regions from the Group By drop-down list.
- In the API Log pane, select an event or a group of sequential events, and click +.

- Enter a name for the created custom region.
To delete the created custom region, click -. To add a nested list inside the created custom region, click +.
Pixel History Tab
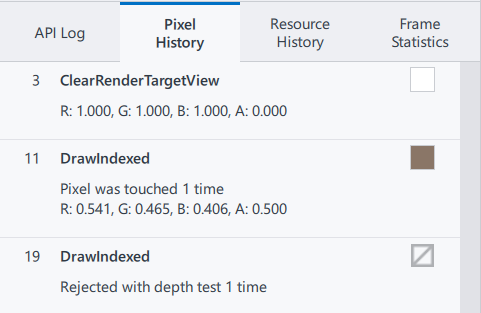
The Pixel History tab shows only the events that contribute into the pixel specified in Resources pane.
To analyze pixel history, select the render target in Resource List and click on the pixel you want to analyze in Resource Viewer. Graphics Frame Analyzer marks the selected pixel with a crosshair and filters the API calls to display only those events that affected this pixel. The colored boxes next to each call show the color written into frame buffer after the API call execution. If the call has been rejected at one of the pipeline stages, the  box is displayed next to the call.

You can use Up/Down arrow keys or Page Up/Page Down keys to navigate between the displayed functions.
Resource History Tab
The Resource History tab shows only the events that use the resource selected from Resource List. To enable the resource history, you can:
- Click Show All Resources button in the Resources pane, double-click any resource in the Resource List, and click the
 button
 - Choose any resource from the Select Resource drop-down list in the Resource History tab
Frame Statistics Tab
The Frame Statistics tab shows the number of calls of each type in the frame.
You can use Up/Down arrow keys or Page Up/Page Down keys to navigate between the displayed functions.