A newer version of this document is available. Customers should click here to go to the newest version.
Window: Temperature/Thermal Sample - Platform Power Analysis
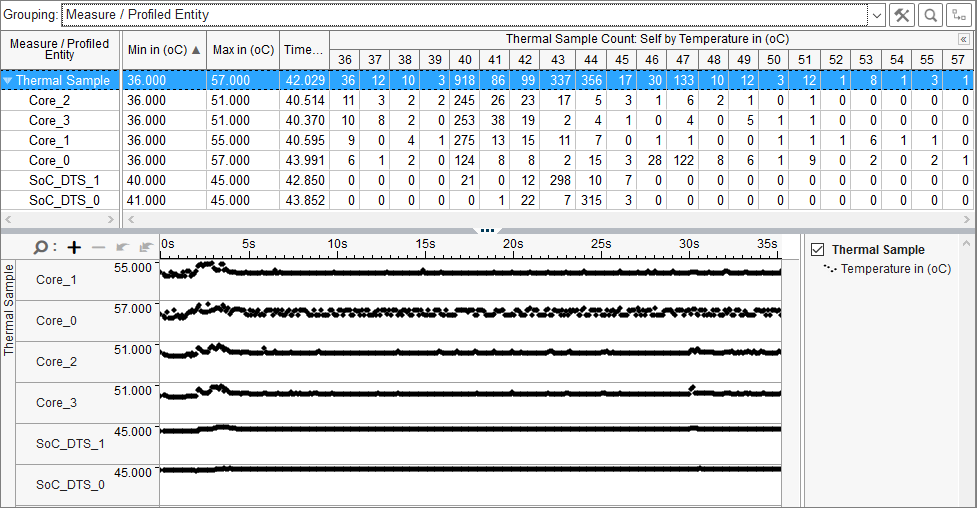
To access this window: Select the Platform Power Analysis viewpoint and click the Temperature (Windows*) or Thermal Sample (Linux*/Android*) sub-tab in the result tab.
Use this window to:
- Identify how much time each core spent in each temperature.
- Review the systems on a core (SOC) temperature samples (Intel Atom® cores only).
Platform Power Analysis viewpoint is available as part of energy analysis. Collecting energy analysis with Intel® SoC Watch is available for target Android*, Windows*, or Linux* devices. Import and viewing of the Intel SoC Watch results is supported with any version of the VTune Profiler.

Temperature Pane
The Temperature pane shows the sample counts at each temperature reading in degrees Celsius (oC) for each core or device. A greater number of sample counts indicates that the device or core spent more of the collection time at that temperature. Click the expand![]() /collapse
/collapse![]() buttons in the data columns to expand the column and show data for different temperature readings in each device. You can change the unit displayed by right-clicking a data cell and selecting the Show Data As option to select an alternate unit. For example, you can display the sample counts as a percentage of the total sample counts.
buttons in the data columns to expand the column and show data for different temperature readings in each device. You can change the unit displayed by right-clicking a data cell and selecting the Show Data As option to select an alternate unit. For example, you can display the sample counts as a percentage of the total sample counts.
Timeline Pane
The Timeline pane displays the temperatures of each core at each point in time during the collection. Expand the timeline rows vertically to view subtle temperature shifts. Zoom in on the timeline to view sampling points. Filters applied on a timeline in one window are applied on all other windows within the viewpoint. This is useful if you identify an issue on one tab and want to see how the issue impacts the metrics shown on a different tab.
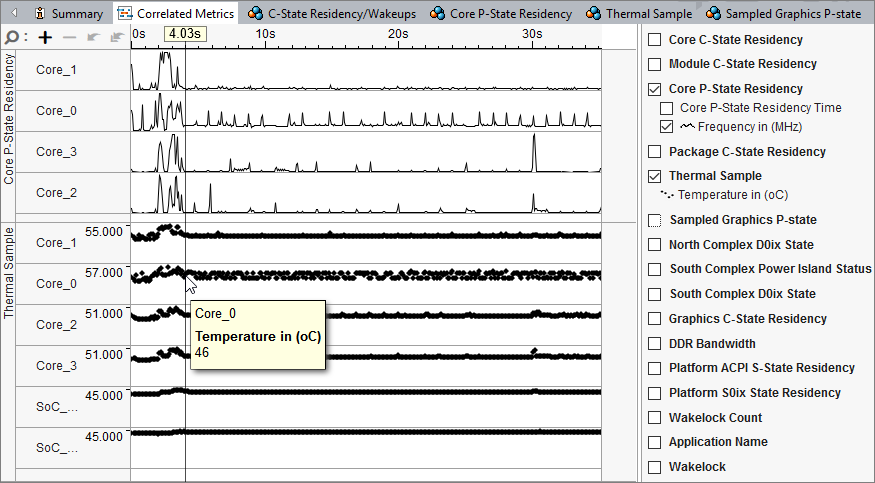
Shifts in core temperature often mirror shifts in processor frequency. When the processor runs at a higher frequency, the temperature also rises. In the following example of the Correlated Metrics tab showing both Thermal Sample and Core P-State Frequency data, both the temperature and the frequency fluctuate for the first 4 seconds of collection and then remain fairly stable.

If the temperature is high, but the frequency is low, it could mean that the CPU is being throttled to lower core temperature.