A newer version of this document is available. Customers should click here to go to the newest version.
Memory Consumption and Allocations View
Explore the data collected with the Memory Consumption analysis for your native or Python* target and identify the most memory-consuming functions, analyze their allocation stacks and source.
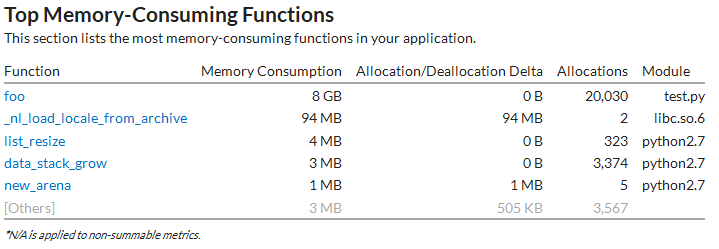
Start with the Summary window that displays a list of top memory-consuming functions.
For example, the foo function has the highest Memory Consumption metric value and could be a candidate for optimization:

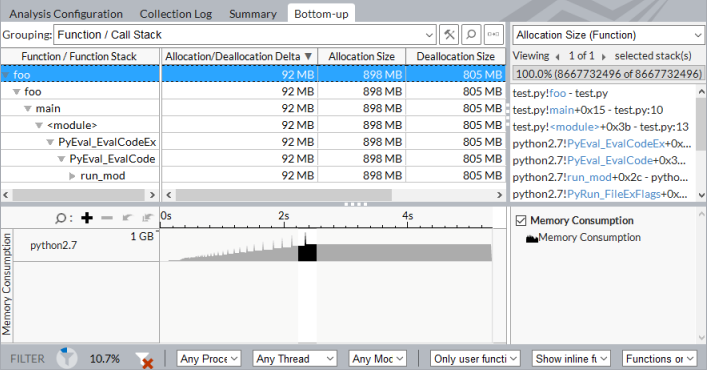
For further investigation, switch to the Bottom-up tab and explore the memory consumption distribution over time. Focus on the peak values on the Timeline pane, select a time range of interest, right click and use the Filter In by Selection context menu option to filter in the program units (functions, modules, processes, and so on) executed during this range:

In the example above, the python foo function allocated 915 310 048 bytes of memory in a call tree displayed in the Call Stack pane on the right but released only 817 830 048 bytes. 92MB is the maximum Allocation/Deallocation delta value that signals a potential memory leak. Clicking the foo function opens the Source view highlighting the code line that allocates the maximum memory. Use this information for deeper code analysis to identify a cause of the memory leaks.