A newer version of this document is available. Customers should click here to go to the newest version.
View Energy Analysis Data with Intel® VTune™ Profiler
Collecting energy analysis data with Intel® SoC Watch is available for target Android*, Windows*, or Linux* devices. Import and viewing of the Intel SoC Watch results is supported with any version of the VTune Profiler.
After you collect energy analysis data on your target system, using the Intel® SoC Watch collector, you can import a result file (*.pwr) to Intel® VTune™ Profiler on your host system, and view Platform Power analysis data with the following windows. The windows that appear depend on which metrics are collected:
Summary Window displays a summary of the data collected. This window is a good starting point for identifying energy issues.
Correlate Metrics window displays timelines for all collected data in the same time scale. This window is a good starting point for identifying energy issues.
Bandwidth window displays the DDR SDRAM memory events and bandwidth usage over time.
Core Wake-ups window displays wake-up events that caused the core to switch from a sleep state to an active state.
CPU C/P States window displays CPU sleep state and processor frequency data correlated. The data is displayed according to the hierarchy for the platform on which the data was collected, and over time.
Graphics C/P States window displays graphics sleep state, and P-state data collected. The data is displayed by device and over time.
NC Device window displays the different D0ix sleep states for North Complex devices, overall counts and over time.
SC Device window displays the different D0ix sleep states for South Complex devices, overall counts and over time.
Thermal Sample window displays the temperature readings from the cores and SoC.
Timer Resolution (Windows* OS only) displays the timer resolution and requests to change it, including the process requesting the change.
Wakelocks window (Android* OS only) displays wakelock data indicating why the system can or cannot enter the ACPI S3 (Suspend-To-RAM) state.
View Component Rows in the Timeline Pane
Some rows can expand and reveal component rows. Look for an arrow next to the row name, as in the timeline shown below.

Zoom in on a Specific Section in the Timeline
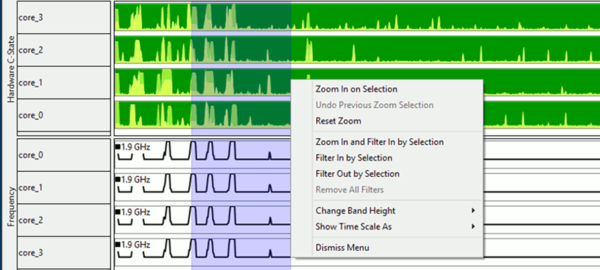
Click and drag horizontally across the rows to select a time interval within the total collection. Release the mouse button to see a list of options for zooming in on this interval. Zoom In and Filter In by Selection is particularly useful because it will not only zoom, but also recalculate all of the grid’s summary data based on the current selection. Once a filter has been applied in one tab it will persist across all tabs within that viewpoint, highlighting the selected time interval on each tab. Right-click and select Remove All Filters to restore the original grid and clear the selection from the timeline.
