A newer version of this document is available. Customers should click here to go to the newest version.
Platform Profiler Analysis
Use the Platform Profiler analysis type to get a holistic view of system behavior. Get insights into platform configuration, utilization, performance, and imbalance issues related to compute, memory, storage, IO and interconnects. Use this low-overhead analysis type to perform system characterization on a deployed system that runs a full load over an extended period.
Platform profiler analysis is a coarse-grained, system level analysis that can help you triage and characterize your system for a particular workload. It differs from the System Overview Analysis in some important ways.
| System Overview Analysis | Platform Profiler Analysis | |
|---|---|---|
| Type of analysis | Fine-grained | Coarse-grained |
| Analysis coverage | Hardware and software | Hardware only |
| Type of workload | Short running (~ few minutes) | Long running (~several hours) |
Use Platform Profiler Analysis to ensure that you use available hardware in the most optimal way for a long running workload.
Configure and Run Analysis
Prerequisite: Create a project.
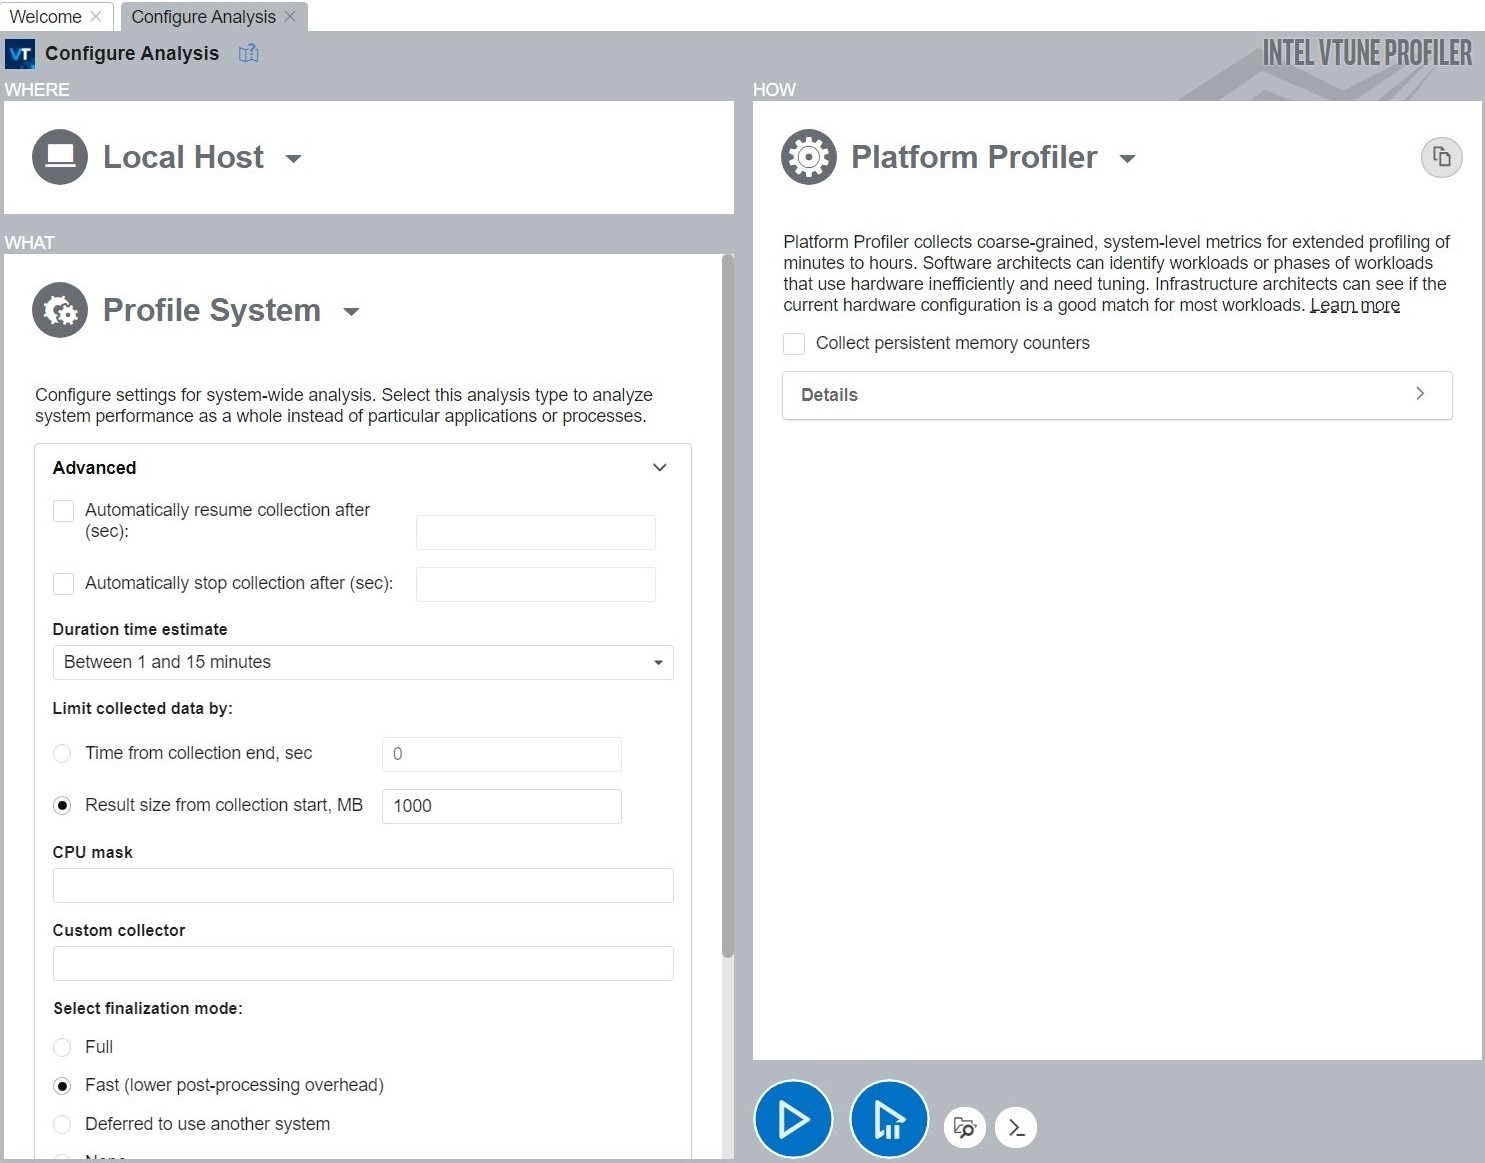
- Click Configure Analysis on the VTune Profiler welcome screen.
- In the Platform Analyses group in the Analysis Tree, select the Platform Profiler analysis type.
- In the WHAT pane, select Profile System. If necessary, you can set limits on the size and time for data collection in the Advanced section.

- Click the
 Start button to run the analysis.
To run this analysis from the command line , click the  Command Line button at the bottom.
Once data collection is complete, see a performance overview in the Platform Profiler viewpoint.
- Platform Profiler View
Use the Platform Profiler viewpoint to examine a performance overview of system behavior. Understand platform-level configuration, utilization and imbalance issues related to compute, memory, storage, IO and interconnects.