A newer version of this document is available. Customers should click here to go to the newest version.
Window: Configure Analysis
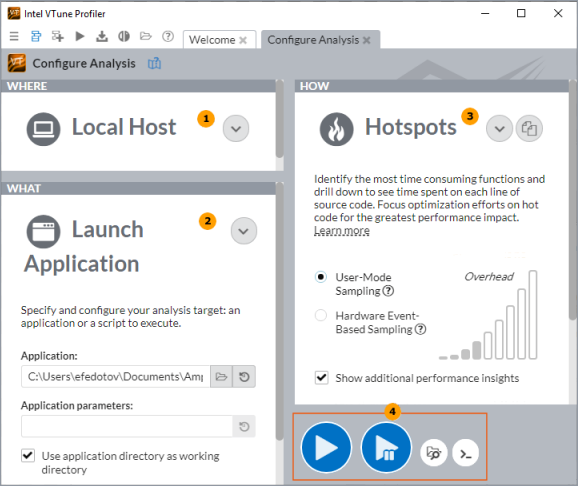
Configure your performance analysis with the Intel VTune Profiler by specifying WHAT you need to profile, a target system WHERE you need to run the collection, and select an analysis type to define HOW you need to analyze your workload.
As soon as you created a project for analysis, the VTune Profiler opens this window that navigates you through the analysis configuration with the following panes:

 |
WHERE: Choose and set up a system for analysis. |
 |
WHAT: Choose and configure your analysis target. |
 |
HOW: Choose and configure performance analysis type. |
 |
Run and control your analysis using these toolbar buttons:
|
 starts the analysis;
 enables you to specify binary and source files for successful post-processing
  creates a