A newer version of this document is available. Customers should click here to go to the newest version.
Threading Efficiency View
Use the Intel® VTune™ Profiler's Threading Efficiency viewpoint to identify causes of poor CPU utilization such as inefficient synchronization.
Use the following workflow to analyze results collected by the Threading analysis type:
- Define a performance baseline
- Examine wait time, spin and overhead time, and thread count metrics
- Review the timeline
- Analyze the application source code
- Explore other analysis types for further diagnosis and optimization
Define a Performance Baseline
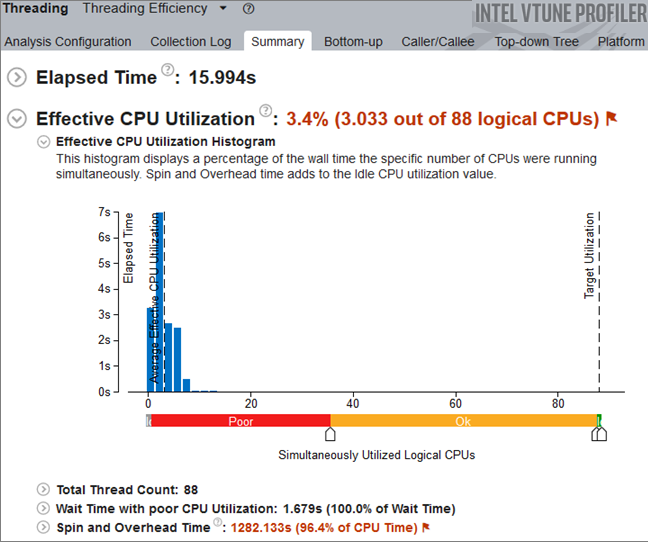
Start with analyzing the application-level data provided in the Summary window for this analysis result. Use the Elapsed time value as a baseline for comparison of results before and after optimization.

Explore the Spin Time, Overhead Time, Wait Time, and Total Thread Count to identify the main cause of performance issues.
Wait Time
A high thread wait time can cause poor CPU utilization. One common problem in parallel applications is threads waiting too long on synchronization objects that are on the critical path of application execution (for example, locks). Parallel performance suffers when waits occur while cores are under-utilized. Threading analysis helps to analyze thread wait time and find synchronization bottlenecks.
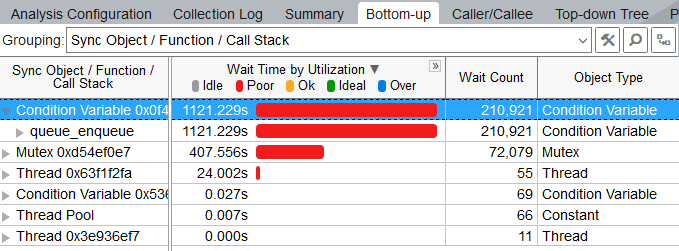
Explore the Bottom-up window to identify the most performance critical synchronization objects. Although it varies, often there are non-interesting threads waiting for a long time on objects infrequently. Usually you are recommended to focus your tuning efforts on the waits with both high Wait Time and Wait Count values, especially if they have poor utilization/concurrency.
By default, the synchronization objects are sorted by Wait time. You can view the time distribution per utilization level by clicking the ![]() button at the Wait Time by Utilization column header to expand the column.
button at the Wait Time by Utilization column header to expand the column.

To identify the highest contributing stack for the synchronization objects selected in the Bottom-up or Top-down Tree panes, use the navigation buttons  on the stack pane. The contribution bar shows the contribution of the currently visible stack to the overall time spent by the selected synchronization objects. You can also use the drop-down list in the Call Stack pane to view data for different types of stacks.
You should try to eliminate or minimize the Wait Time for the synchronization objects with the highest Wait Time (or longest red bars, if the bar format is selected) and Wait Count values.
In Hardware Event-based Sampling and Context Switches mode, sort functions by Inactive Sync Wait Time. Use the Caller/Callee pane to figure out the call sites in the application that calls a wait function with high Inactive Sync Wait Time.
Spin and Overhead Time
Threading analysis shows how much time the application spends in threading runtimes either because of busy waits or overhead on parallel work arrangement. The goal is to minimize CPU cycles that are spent either on active wait or task scheduling. Look at the call paths for functions with higher spin and overhead time of application execution and follow the advice of flagged issues to reduce the time.
The spin time shown in Spin and Overhead Time section might be included into wait time based on user-level sampling and tracing.
Thread Count
Threading analysis will show time an application spends in oversubscription by flagging when the application is running more threads than the number of logical cores on the machine. Running an excessive number of threads can cause a higher CPU time because some of the threads may be waiting on others to complete or time may be wasted on context switches. Another common issue is running with a fixed number of threads, which can cause performance degradation when running on a platform with a different number of cores. For example, running with a significantly lower number of threads than the number of cores available can cause higher application elapsed time.
Use the Total Thread Count metric available on the Summary window to determine if your application has thread oversubscription or could benefit from increased threading.
In Hardware Event-based Sampling and Context Switches mode, use the Preemption Wait Time metric to estimate the impact of oversubscription. The higher the metric value on worked threads, the higher the impact of oversubscription on the application performance. Note that thread preemption can also be triggered by a conflict with other applications or kernel threads running on a system.
Review the Timeline
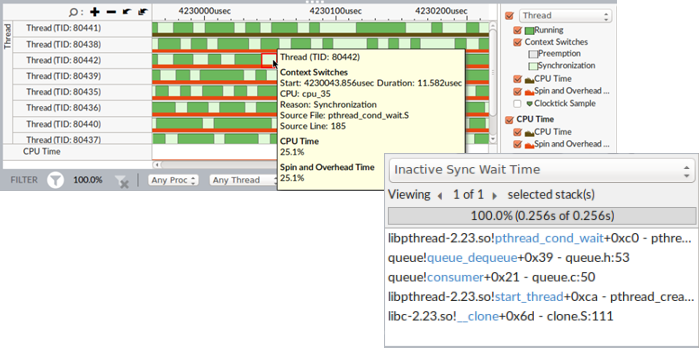
The Timeline pane at the bottom of the Bottom-up/Top-down Tree windows shows the thread behavior in your application and how CPU utilization metrics are changing over time. Analyze the data, select the problem area, and zoom in to selection using the context menu options. VTune Profiler calculates the overall CPU Utilization metric as the sum of CPU time per each thread of the Threads area. Maximum CPU Utilization value is equal to [number of processor cores] x 100%.

To understand what your application was doing during a particular time frame, select this range on the timeline, right-click and choose Zoom In and Filter In by Selection. VTune Profiler will display functions or sync objects used during this time range.
For User-mode Sampling and Tracing collection mode, select the Transitions option on the timeline to explore thread interactions.

For Hardware Event-based Sampling and Context Switches mode, the timeline is helpful in exploring inactive waits. Select an inactive time area on the timeline to display the wait stack on the stack pane that corresponds to the context switch.

Analyze Source
Double-click the hottest synchronization object (with the highest Wait Time and Wait Count values) to view its related source code file in the Source/Assembly window. From the Timeline pane, you can double-click the transition line to open the call site for this transition. You can open the code editor directly from the VTune Profiler and edit your code.
Explore Other Analysis Types
Run the comparison analysis to understand the performance gain you obtain after your optimization.
Run Microarchitecture Exploration analysis to identify hardware issues affecting the performance of your application.