A newer version of this document is available. Customers should click here to go to the newest version.
GPU Offload Analysis
Explore code execution on various CPU and GPU cores on your platform, correlate CPU and GPU activity, and identify whether your application is GPU or CPU bound.
Run the GPU Offload analysis for applications that use a Graphics Processing Unit (GPU) for rendering, video processing, and computations with explicit support of SYCL*, Intel® Media SDK and OpenCL™ software technology.
The tool infrastructure automatically aligns clocks across all cores in the entire system so that you can analyze some CPU-based workloads together with GPU-based workloads within a unified time domain.
This analysis enables you to:
Identify how effectively your application uses SYCL or OpenCL kernels and explore them further with GPU Compute/Media Hotspots analysis
Analyze execution of Intel Media SDK tasks over time (for Linux targets only)
Explore GPU usage and analyze a software queue for GPU engines at each moment of time
For the GPU Offload analysis, Intel® VTune™ Profiler instruments your code executing both on CPU and GPU. Depending on your configuration settings, VTune Profiler provides performance metrics that give you an insight into the efficiency of GPU hardware use. You can also identify next steps in your analysis.
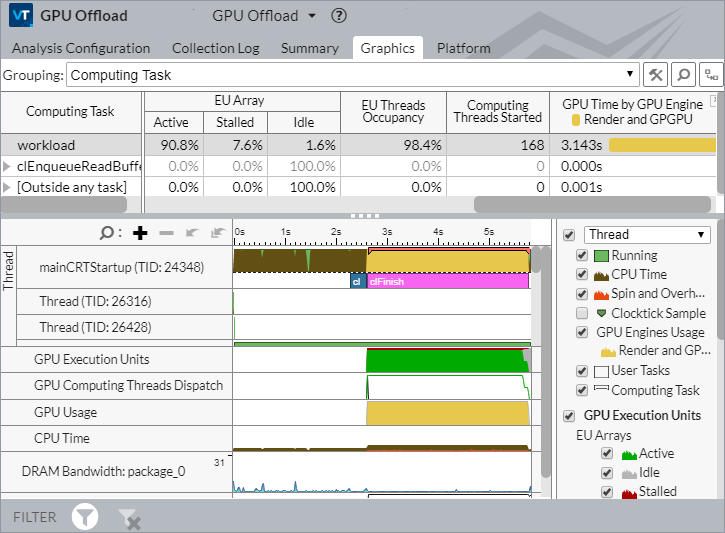
Aspects of the GPU Offload Analysis
By default, the GPU Offload analysis enables the GPU Utilization option to explore GPU busyness over time and understand whether your application is CPU or GPU bound. Consequently, if you explore the Timeline view in the Graphics window, you may observe:
- The GPU is busy most of the time
- There are small idle gaps between busy intervals
- The GPU software queue is rarely decreased to zero
If these behaviors exist, you can conclude that your application is GPU bound.
If the gaps between busy intervals are big and the CPU is busy during these gaps, your application is CPU bound.
But such obvious situations are rare and you need a detailed analysis to understand all dependencies. For example, an application may be mistakenly considered GPU bound when the usage of GPU engines is serialized (for example, when GPU engines responsible for video processing and for rendering are loaded in turns). In this case, an ineffective scheduling on the GPU results from the application code running on the CPU.
Configure the Analysis
On Windows systems, to monitor general GPU usage over time, run VTune Profiler as an Administrator.
For SYCL applications: make sure to compile your code with the -gline-tables-only and -fdebug-info-for-profiling Intel oneAPI DPC++ Compiler options.
Create a project and specify an analysis system and target.
Run the Analysis
Open the Configure Analysis window. Click the
 button on the welcome screen (standalone version) or the
  Configure Analysis(Visual Studio IDE) toolbar button.
 Open the Analysis Tree from the HOW pane and select GPU Offload analysis from the Accelerators group.
The GPU Offload analysis is pre-configured to collect GPU usage data and collect Processor Graphics hardware events (Compute Basic preset).
NOTE:If you have multiple Intel GPUs connected to your system, run the analysis on the GPU of your choice or on all connected devices. For more information, see Analyze Multiple GPUs.
Configure these GPU analysis options:
Use the Trace GPU programming APIs option to analyze SYCL, Level-Zero, OpenCL™, and Intel Media SDK programs running on Intel Processor Graphics. This option may affect the performance of your application on the CPU side.
Use the Collect host stacks option to analyze call stacks executed on the CPU and identify critical paths. You can also examine the CPU-side stacks for GPU computing tasks to investigate the efficiency of your GPU offload. When results display, sort through SYCL*, Level-Zero, or OpenCL™ runtime call stacks by selecting a Call Stack mode in the filter bar.
Use the Analyze CPU-GPU bandwidth option to display data transfers based on hardware events on the timeline. This type of analysis requires Intel sampling drivers to be installed.
For GPUs with Xe Link connections, use the Analyze Xe Link Usage option to examine the traffic between GPU interconnects (Xe Link). This information can help you assess data flow between GPUs and the usage of the Xe Link.
Use the Show GPU performance insights to get metrics (based on the analysis of Processor Graphics events) that help you estimate the efficiency of hardware usage and learn next steps. The following Insights metrics are collected:
The EU Array metric shows the breakdown of GPU core array cycles, where:
Active: The normalized sum of all cycles on all cores spent actively executing instructions. Formula:

Stalled: The normalized sum of all cycles on all cores spent stalled. At least one thread is loaded, but the core is stalled for some reason. Formula:

Idle: The normalized sum of all cycles on all cores when no threads were scheduled on a core. Formula:

- The EU Threads Occupancy metric shows the normalized sum of all cycles on all cores and thread slots when a slot has a thread scheduled.
The Computing Threads Started metric shows the number of threads started across all EUs for compute work.

Click Start to run the analysis.
Run from Command Line
Type this command:
$ vtune -collect gpu-offload [-knob <knob_name=knob_option>] -- <target> [target_options]
To generate the command line for any analysis configuration, use the Command Line button at the bottom of the interface.
Once the GPU Offload Analysis completes data collection, the Summary window displays metrics that describe:
- GPU usage
- GPU idle time
- Xe Link Usage
- The most active computing tasks that ran on the CPU host
- The most active computing tasks that ran on the CPU when the GPU was idle
- The most active computing tasks that ran on the GPU, along with occupancy information
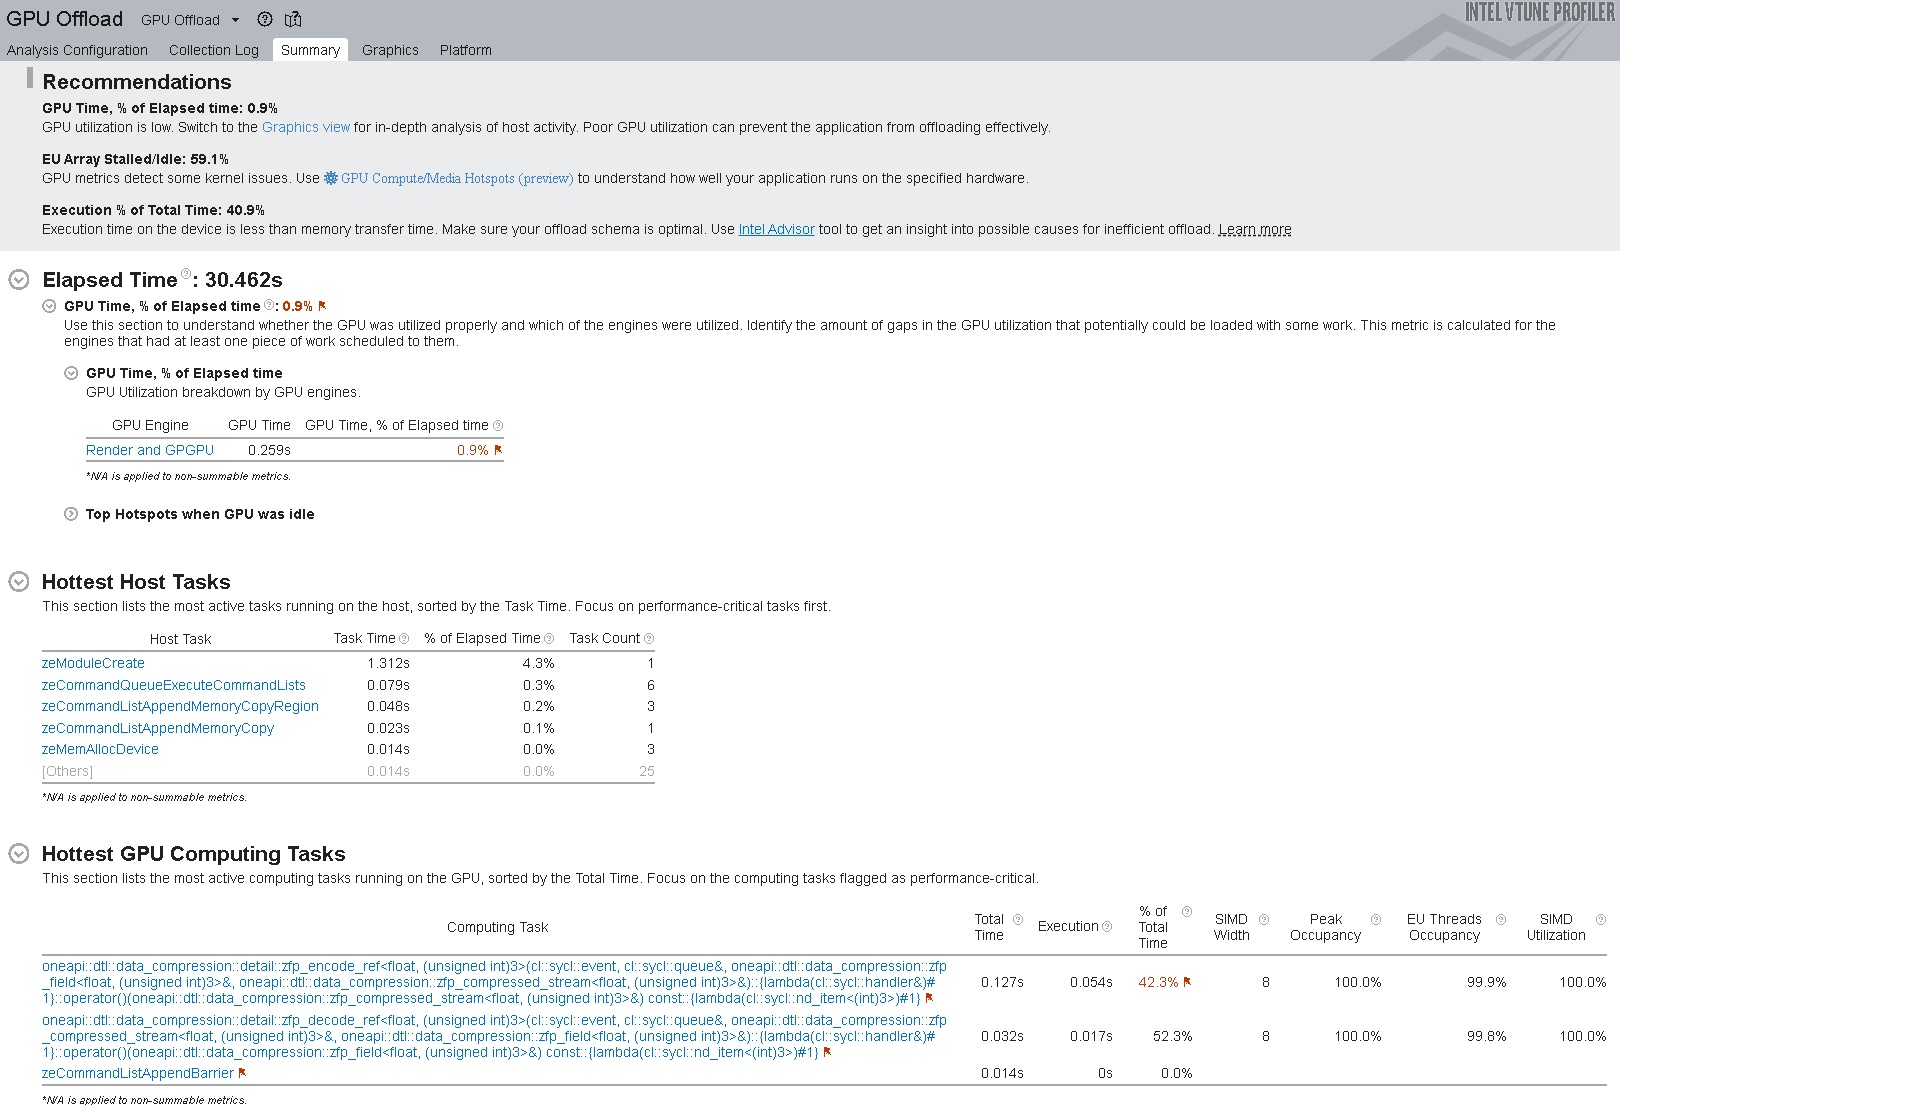
You also see Recommendations and guidance for next steps.
Analyze Multiple GPUs
If you connect multiple Intel GPUs to your system, VTune Profiler identifies all of these adapters in the Target GPU pull down menu. Follow these guidelines:
- Use the Target GPU pulldown menu to specify the device you want to profile.
- The Target GPU pulldown menu displays only when VTune Profiler detects multiple GPUs running on the system. The menu then displays the name of each GPU with the bus/device/function (BDF) of its adapter. You can also find this information on your Windows (see Task Manager) or Linux (run lspci) system.
- If you do not select a GPU, VTune Profiler selects the most recent device family in the list by default.
- Select All devices to run the analysis on all of the GPUs connected to your system.
- Full compute set in Characterization mode is not available for multi-adapter/tile analysis.
Once the analysis completes, VTune Profiler displays summary results per GPU including tile information in the Summary window.
The GPU Topology Diagram
When you run a GPU analysis across multiple Intel GPUs (or multi-stack GPUs) connected to your system, the Summary window displays interconnections between these GPUs in the GPU Topology diagram. This diagram contains cross-GPU information for a maximum of 2 sockets and 6 GPUs connected to the system.
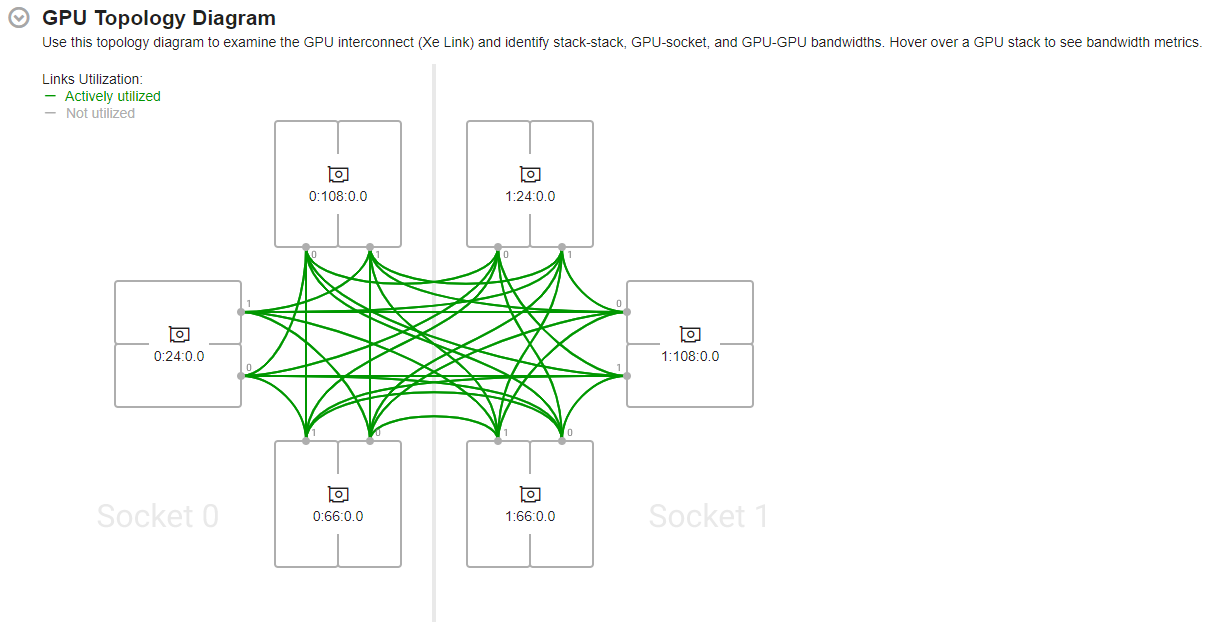
The GPU Topology diagram displays topological information about the sockets (available for GPU connection) as well as interconnect (Xe Link) connections between GPUs. You can identify GPUs in the GPU Topology diagram by their Bus Device Function (BDF) numbers.
Hover over a GPU stack to see actively utilized links (highlighted in green) and corresponding bandwidth metrics.
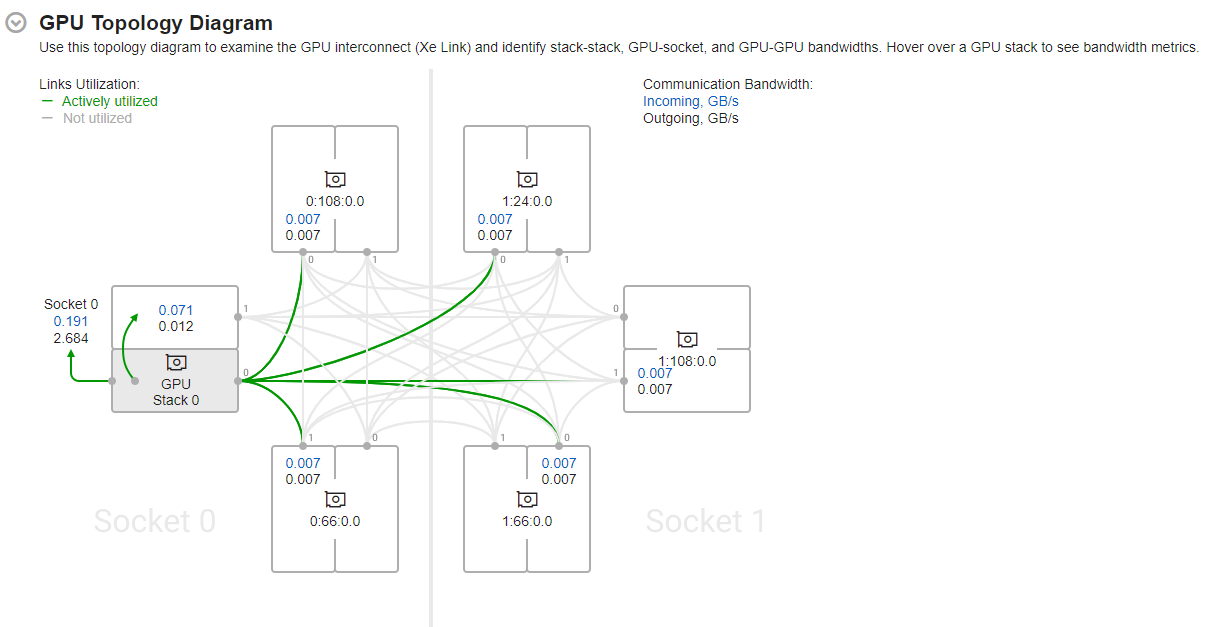
Use the information presented here to see average data transferred:
- Through Xe Links
- Between GPU stacks
- Between GPUs and sockets
Analyze Xe Link Usage
For GPUs with Xe Link connections, when you check the option (before running the analysis) to analyze interconnect (Xe Link) usage, the Summary window includes a section that displays the aggregated bandwidth and traffic data through GPU interconnects (Xe Link). Use this information with the GPU Topology diagram to detect any imbalances in the distribution of traffic between GPUs. See if some links are used more frequently than others, and understand why this is happening.
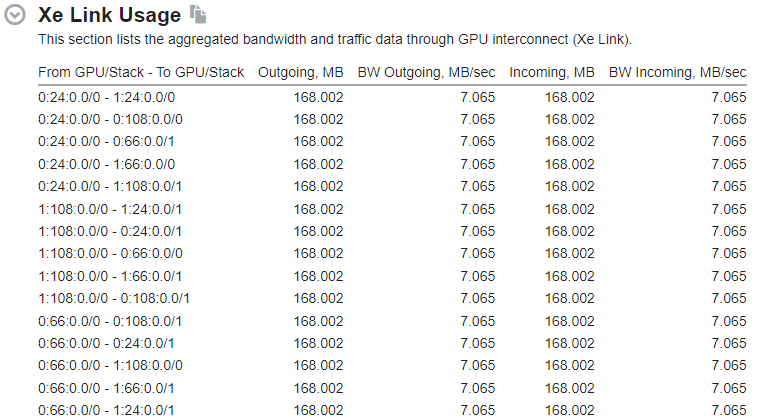
Along with the Xe Link usage information in the Summary window, the Platform window displays bandwidth data over time.
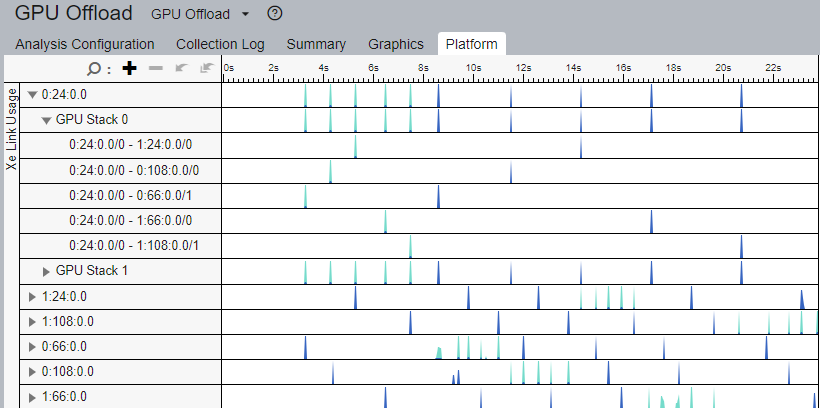
Use this information to:
- Match traffic data with kernels or code execution.
- See the bandwidth during any time of the execution of the application.
- Understand how the use of Xe Links improves the performance of your application.
- Verify if the Xe Links reached the bandwidth expected during application execution.
Analyze Data Transfer Between Host and Device
To understand the efficiency of data transfer between the CPU host and GPU device, see metrics in the Summary and Graphics windows.
The Summary window displays the total time spent on computing tasks as well as the execution time per task. The difference indicates the amount of time spent on data transfers between host and device. If the execution time is lower than the data transfer time, this indicates that your offload schema could benefit from optimization.
In the Summary window, look for offload cost metrics including Host-to-Device Transfer and Device-to-Host Transfer. These metrics can help you locate unnecessary memory transfers that reduce performance.
In the Graphics window, see the Total Time by Device Operation Type column, which displays the total time for each computation task.

The total time is broken down into:
- Allocation time
- Time for data transfer from host to device
- Execution time
- Time for data transfer from device to host
This breakdown can help you understand better the balance between data transfer and GPU execution time. The Graphics window also displays in the Transfer Size section, the size of the data transfer between host and device per computation task.
Computation tasks with sub-optimal offload schemas are highlighted in the table with details to help you improve those schemes.

Examine Energy Consumption by your GPU
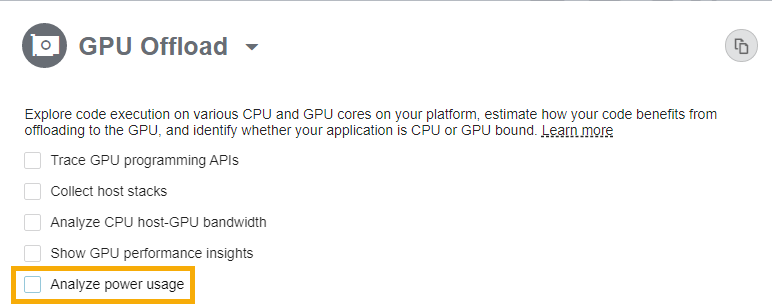
In Linux environments, when you run the GPU Offload analysis on an Intel® Iris® X e MAX graphics discrete GPU, you can see energy consumption information for the GPU device. To collect this information, make sure you check the Analyze power usage option when you configure the analysis.
Once the analysis completes, see energy consumption data in these sections of your results.
In the Graphics window, observe the Energy Consumption column in the grid when grouped by Computing Task. Sort this column to identify the GPU kernels that consumed the most energy. You can also see this information mapped in the timeline.
When you locate individual GPU kernels that consume the most energy, for optimum power efficiency, start by tuning the top energy hotspot.
If your goal is to optimize GPU processing time, keep a check on energy consumption metrics per kernel to monitor the tradeoff between performance time and power use.
Move the Energy Consumption column next to Total Time to make this comparison easier.
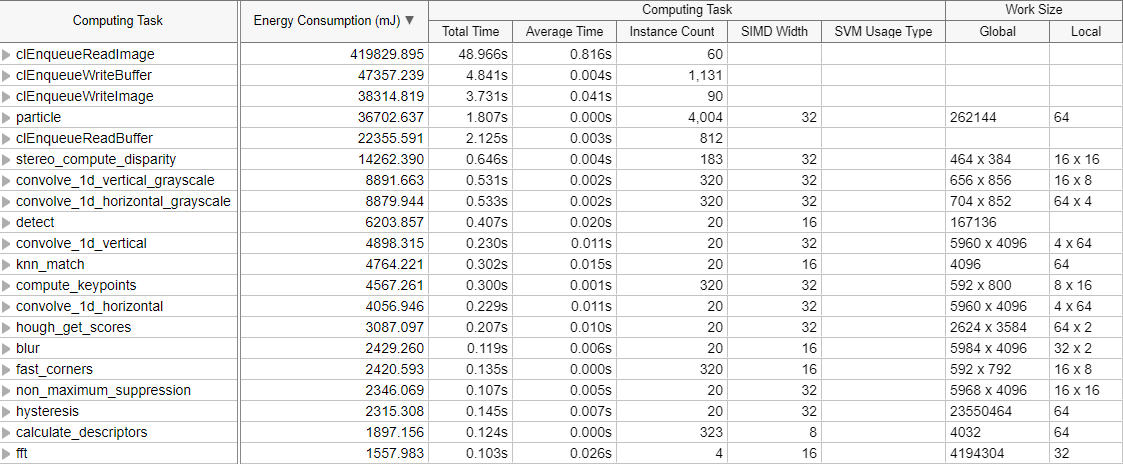
You may notice that the correlation between power use and processing time is not direct. The kernels that compute the fastest may not be the same kernels that consume the least amounts of energy. Check to see if larger values of power usage correspond to longer stalls/wait periods.
Support for SYCL* Applications using oneAPI Level Zero API
This section describes support in the GPU Offload analysis for SYCL applications that run OpenCL or oneAPI Level Zero API in the back end. VTune Profiler supports version 1.0.4 of the oneAPI Level Zero API.
Support Aspect |
SYCL application with OpenCL as back end |
SYCL application with Level Zero as back end |
|---|---|---|
Operating System |
Linux OS Windows OS |
Linux OS Windows OS |
Data collection |
VTune Profiler collects and shows GPU computing tasks and the GPU computing queue. |
VTune Profiler collects and shows GPU computing tasks and the GPU computing queue. |
Data display |
VTune Profiler maps the collected GPU HW metrics to specific kernels and displays them on a diagram. |
VTune Profiler maps the collected GPU HW metrics to specific kernels and displays them on a diagram. |
Display Host side API calls |
Yes |
Yes |
Source Assembler for computing tasks |
Yes |
Yes |
Support for DirectX Applications
This section describes support available in the GPU analysis to trace Microsoft® DirectX* applications running on the CPU host. This support is available in the Launch Application mode only.
| Support Aspect | DirectX Application |
|---|---|
Operating system |
Windows OS |
API version |
DXGI, Direct3D 11, Direct3D 12, Direct3D 11 on 12 |
Display host side API calls |
Yes |
Direct Machine Learning (DirectML) API |
Yes |
Device side computing tasks |
No |
Source Assembler for computing tasks |
No |