A newer version of this document is available. Customers should click here to go to the newest version.
Hybrid CPU Analysis
Understand how to use Intel® VTune™ Profiler to run analyses on hybrid CPUs with several types of cores.
A hybrid CPU combines several types of cores on the same die. For example, Intel® microarchitectures code named Alder Lake have two types of cores - Performance cores (P-Cores) and Efficient Cores(E-Cores). When you profile applications that run on hybrid CPUs, use these techniques to conduct a good performance analysis.
Group by Core Type
When you run hardware event-based sampling analysis, VTune Profiler detects the various types of CPU cores and provides you with an option to group or filter the profiling results by Core Type entity. Use this grouping to understand:
- The time spent by the application on each core type
- What portion of the code was executed in a certain location
- Moments when transitions happened
Group by Core Type in Grid
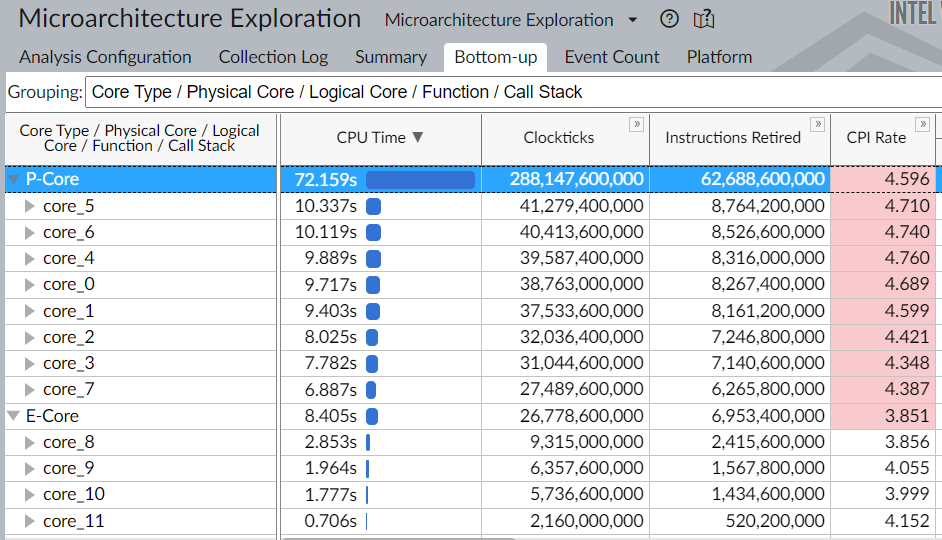
In the grid view in the Bottom-up window, select one of the groupings that feature 'Core Type'. For example, this table displays grouping by Core Type / Physical Core / Logical Core / Function / Call Stack.

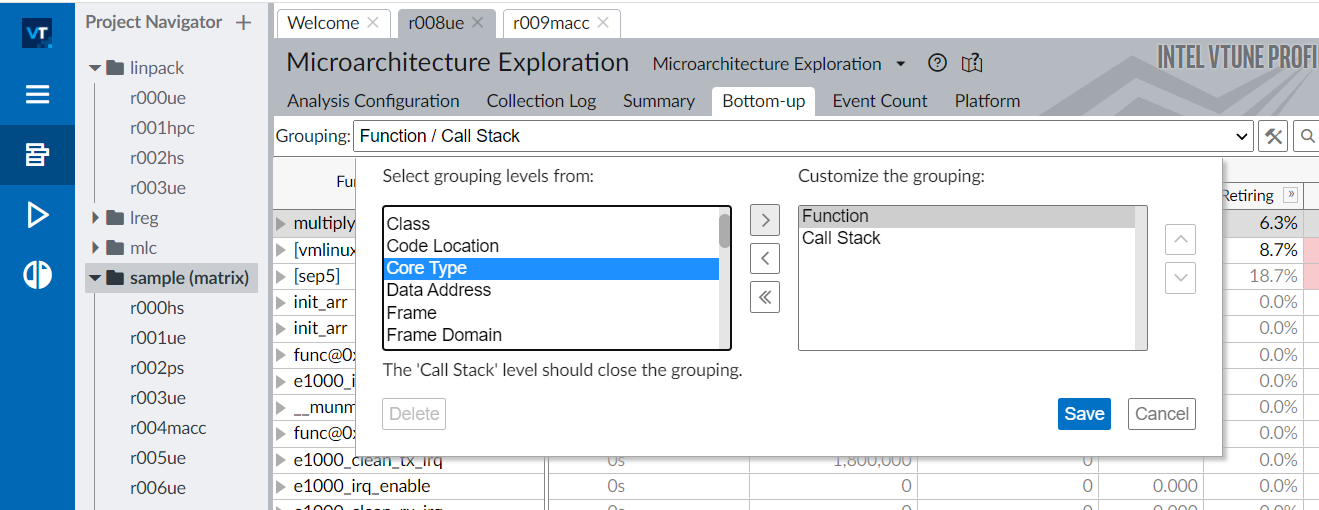
You can also create your own grouping and include the 'Core Type' entity in it. To do this, use the Customize Grouping dialog box from the Grouping pulldown menu and select your combination of entities.

Group by Core Type in Timeline
You can also use the timeline view to group data by Core Type. To do this, select one of the available groupings (from the pulldown menu) that contain the Core Type entity. This example shows the Process / Core Type grouping in the timeline.

Metrics for Hybrid CPUs
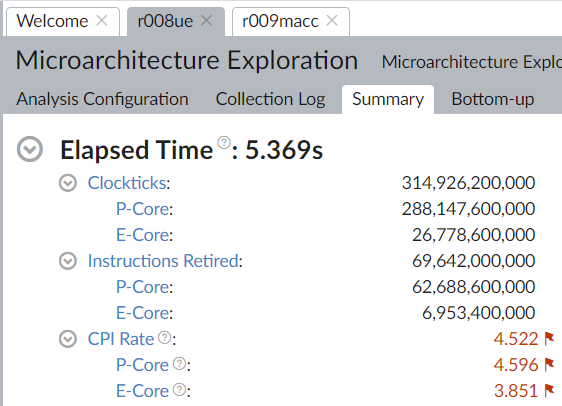
When you profile applications on hybrid platforms, several metrics in the Summary window display data per core type as well as data that is aggregated across all core types.

Microarchitecture Exploration Metrics
This image displays the metric hierarchy in the results of a Microarchitecture Exploration analysis. The data is displayed per core type for hybrid processors.

Use this hierarchical display of data to analyze microarchitecture bottlenecks in P-Cores and E-Cores. You will also find a similar breakdown by core type in other analysis types (Memory Access or HPC Performance Characterization) since they share some of the same metrics.