A newer version of this document is available. Customers should click here to go to the newest version.
Window: System Sleep States - Platform Power Analysis
To access this window: Select the Platform Power Analysis viewpoint and click the System Sleep States sub-tab in the result tab.
Use the System Sleep States window to:
- Analyze the time spent in different ACPI-defined system sleep states (S-States).
System sleep states are available for system on a chip (SoC) platforms when the display is disabled, but the system may still be active. As with other active and inactive states, the S0i0 state is the active state. The S0ix state is when the CPU is inactive, but another device is active. For example, the display may be turned off, but audio playback is enabled, which does not allow the system to enter the deepest sleep state. The S0i3 is the deepest sleep state, which is achieved when the device is in power-saving mode (referred to as connected standby for Windows* devices).
Platform Power Analysis viewpoint is available as part of energy analysis. Collecting energy analysis with Intel® SoC Watch is available for target Android*, Windows*, or Linux* devices. Import and viewing of the Intel SoC Watch results is supported with any version of the VTune Profiler.

System Sleep States Pane
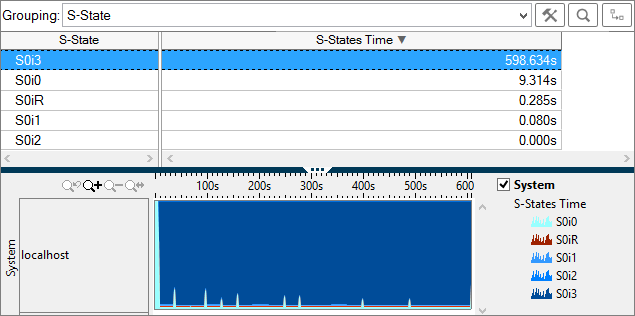
The System Sleep States pane lists the different S-States and the amount of time the system spent in each state. Click the expand![]() /collapse
/collapse![]() buttons in the data columns to expand the column and show data for different S-States in each device. You can change the unit displayed by right-clicking a data cell and selecting the Show Data As option to select an alternate unit. For example, you could select Show Data As > Percent to view the percent of collection time a particular device spent in the active state.
buttons in the data columns to expand the column and show data for different S-States in each device. You can change the unit displayed by right-clicking a data cell and selecting the Show Data As option to select an alternate unit. For example, you could select Show Data As > Percent to view the percent of collection time a particular device spent in the active state.
In the following example, the system never leaves the active S0i0 state. Either the CPU is active or one or more devices kept the system active during collection. The active devices can be identified by switching to the NC Device States tab or the SC Device States tab and looking for a device or devices that were active during the collection. Use the CPU C/P States window to check the CPU activity level.

Timeline Pane
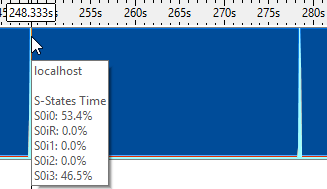
The Timeline pane displays the S-States of the system at each point in time. Each state is shown in a different color. Use the legend on the right to see the colors related to the different states or features. Zoom in on the timeline to better view the transitions between inactive and active states. Hover over the timeline to view the percent of time spent in each state.

Filters applied on a timeline in one window are applied on all other windows within the viewpoint. This is useful if you identify an issue on one tab and want to see how the issue impacts the metrics shown on a different tab.