A newer version of this document is available. Customers should click here to go to the newest version.
HPC Performance Characterization Analysis
Use the HPC Performance Characterization analysis to identify how effectively your compute-intensive application uses CPU, memory, and floating-point operation hardware resources.
How It Works
The HPC Performance Characterization analysis type can be used as a starting point for understanding the performance aspects of your application. Additional scalability metrics are available for applications that use Intel OpenMP* or Intel MPI runtime libraries.

During HPC Performance Characterization analysis, the Intel® VTune™ Profiler data collector profiles your application using event-based sampling collection. OpenMP analysis metrics for Intel OpenMP runtime library are based on User API instrumentation enabled in the runtime library.
Typically the collector will gather data for a specified application, but it can collect system-wide performance data with limited detail if required.
Vectorization and GFLOPS metrics are supported on Intel® microarchitectures formerly code named Ivy Bridge, Broadwell, and Skylake. Limited support is available for Intel® Xeon Phi™ processors formerly code named Knights Landing. The metrics are not currently available on 4th Generation Intel processors. Expand the Details section on the analysis configuration pane to view the processor family available on your system.
The analysis can be run from within the VTune Profiler GUI or from the command line.
Intel® VTune™ Profiler is a new renamed version of the Intel® VTune™ Amplifier.
Configure and Run Analysis
To configure options for the HPC Performance Characterization analysis:
Prerequisites: Create a project.
Click the
 (standalone GUI)/
 (Visual Studio IDE)Configure Analysis button on the Intel® VTune™ Profiler toolbar.
 The Configure Analysis window opens.
From HOW pane, click the
 Browse button and select HPC Performance Characterization.
 Configure the following options:
CPU sampling interval, ms field
Specify an interval (in milliseconds) between CPU samples.
Possible values - 0.01-1000.
The default value is 1.
Collect stacks check box
Enable advanced collection of call stacks and thread context switches.
The option is disabled by default.
Analyze memory bandwidth check box
Collect the data required to compute memory bandwidth.
The option is enabled by default.
Evaluate max DRAM bandwidth check box
Evaluate maximum achievable local DRAM bandwidth before the collection starts. This data is used to scale bandwidth metrics on the timeline and calculate thresholds.
The option is enabled by default.
Analyze OpenMP regions check box
Instrument and analyze OpenMP regions to detect inefficiencies such as imbalance, lock contention, or overhead on performing scheduling, reduction and atomic operations.
The option is enabled by default.
Details button
Expand/collapse a section listing the default non-editable settings used for this analysis type. If you want to modify or enable additional settings for the analysis, you need to create a custom configuration by copying an existing predefined configuration. VTune Profiler creates an editable copy of this analysis type configuration.
NOTE:You may generate the command line for this configuration using the
 Command Line button at the bottom.
 Click the
 Start button to run the analysis.
View Data
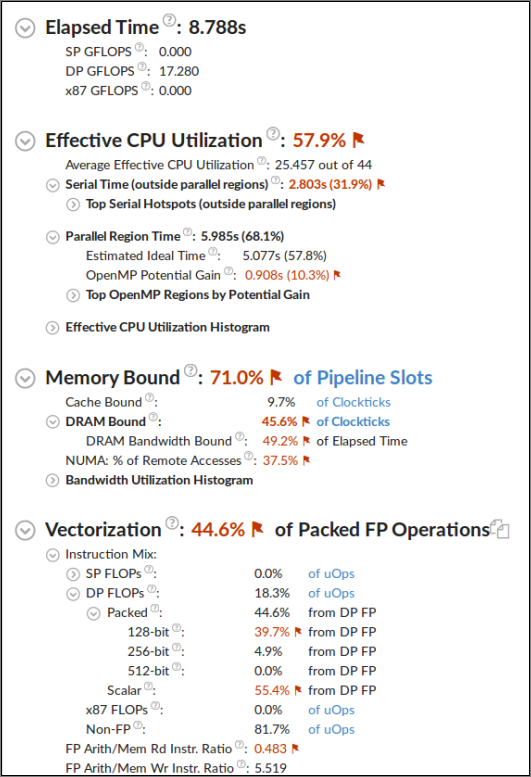
Use the HPC Performance Characterization viewpoint to review the following:
Effective Physical Core Utilization: Explore application parallel efficiency by looking at physical core utilization by the application code execution. Look for scalability problems involving the use of serial time versus parallel time, tuning potential for OpenMP regions, and MPI imbalance.
Memory Bound: Evaluate whether the application is memory bound. To understand deeper problems, run the Memory Access Analysis to identify specific memory objects causing issues.
Vectorization: Determine if floating-point loops are bandwidth bound or vectorized. For bandwidth bound loops/functions, run the Memory Access Analysis to reduce bandwidth consumption. For vectorization optimization opportunities, use the Intel Advisor to run a vectorization analysis.
Intel® Omni-Path Fabric Usage: Identify performance bottlenecks caused by reaching the interconnect limits.
Use the Analyzing an OpenMP* and MPI Application tutorial to review basic steps for tuning a hybrid application. The tutorial is available from the Intel Developer Zone at https://software.intel.com/en-us/itac-vtune-mpi-openmp-tutorial-lin.