Visible to Intel only — GUID: puh1597272893583
Ixiasoft
1.1.1. Timing Path and Clock Analysis
1.1.2. Clock Setup Analysis
1.1.3. Clock Hold Analysis
1.1.4. Recovery and Removal Analysis
1.1.5. Multicycle Path Analysis
1.1.6. Metastability Analysis
1.1.7. Timing Pessimism
1.1.8. Clock-As-Data Analysis
1.1.9. Multicorner Timing Analysis
1.1.10. Time Borrowing
2.1. Using Timing Constraints throughout the Design Flow
2.2. Timing Analysis Flow
2.3. Applying Timing Constraints
2.4. Timing Constraint Descriptions
2.5. Timing Report Descriptions
2.6. Scripting Timing Analysis
2.7. Using the Quartus® Prime Timing Analyzer Document Revision History
2.8. Quartus® Prime Pro Edition User Guide: Timing Analyzer Archive
2.4.4.5.1. Default Multicycle Analysis
2.4.4.5.2. End Multicycle Setup = 2 and End Multicycle Hold = 0
2.4.4.5.3. End Multicycle Setup = 2 and End Multicycle Hold = 1
2.4.4.5.4. Same Frequency Clocks with Destination Clock Offset
2.4.4.5.5. Destination Clock Frequency is a Multiple of the Source Clock Frequency
2.4.4.5.6. Destination Clock Frequency is a Multiple of the Source Clock Frequency with an Offset
2.4.4.5.7. Source Clock Frequency is a Multiple of the Destination Clock Frequency
2.4.4.5.8. Source Clock Frequency is a Multiple of the Destination Clock Frequency with an Offset
2.5.1. Report Fmax Summary
2.5.2. Report Timing
2.5.3. Report Timing By Source Files
2.5.4. Report Data Delay
2.5.5. Report Net Delay
2.5.6. Report Clocks and Clock Network
2.5.7. Report Clock Transfers
2.5.8. Report Metastability
2.5.9. Report CDC Viewer
2.5.10. Report Asynchronous CDC
2.5.11. Report Logic Depth
2.5.12. Report Neighbor Paths
2.5.13. Report Register Spread
2.5.14. Report Route Net of Interest
2.5.15. Report Retiming Restrictions
2.5.16. Report Register Statistics
2.5.17. Report Pipelining Information
2.5.18. Report Time Borrowing Data
2.5.19. Report Exceptions and Exceptions Reachability
2.5.20. Report Bottlenecks
2.5.21. Check Timing
2.5.22. Report SDC
3.1.1. CDC Timing Overview
3.1.2. Identifying CDC Timing Issues Using Design Assistant
3.1.3. Identifying CDC Timing Issues Using Timing Reports
3.1.4. Debug CDC Example 1—Incorrect SDC Definition
3.1.5. Debug CDC Example 2—Additional Logic in the Crossing
3.1.6. Debug CDC Example 3—CDC Depending on Two Simultaneous Clock Domains
Visible to Intel only — GUID: puh1597272893583
Ixiasoft
2.5.12. Report Neighbor Paths
The Timing Analyzer's Reports > Design Metrics > Report Neighbor Paths... command helps you to determine the root cause of critical paths (for example, high logic level, retiming limitation, sub-optimal placement, I/O column crossing, hold fix-up, time borrowing, or others). The equivalent scripting command is report_design_metrics -neighbor_paths.
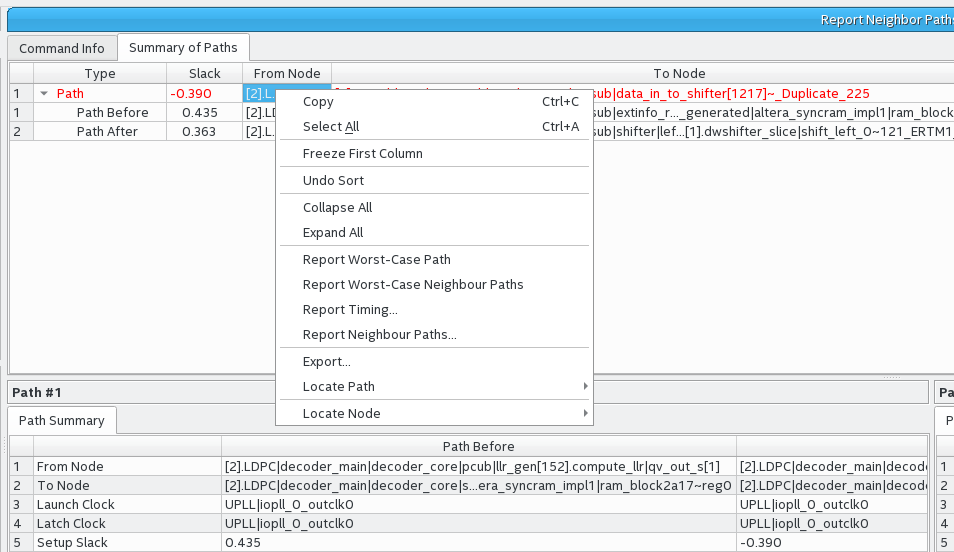
Figure 169. Report Neighbor Paths Report


Report Neighbor Paths reports the most timing-critical paths in the design, including associated slack, additional path summary information, and path bounding boxes. Report Neighbor Paths shows the most timing-critical Path Before and Path After each critical Path. You can optionally view multiple before and after paths. Retiming or logic balancing of the Path can simplify timing closure if there is negative slack on the Path, but positive slack on the Path Before or Path After.
| Option | Description |
|---|---|
| Clocks | From Clock and To Clock filter paths in the report to show only the launching or latching clocks you specify. |
| Targets | Specifies the target node for From Clock and To Clock to report neighbor paths with only those endpoints. Specify an I/O or register name or I/O port for this option. The field also supports wildcard characters. When the From, To, or Through boxes are empty, the Timing Analyzer assumes all possible targets in the device. The Through option limits the report for paths that pass through combinatorial logic, or a particular pin on a cell. |
| Analysis type | The Analysis type options are Setup, Hold, Recovery, or Removal. The Timing Analyzer reports the results for the type of analysis you select. |
| Paths | Specifies the number of paths to display by endpoint and slack level. The default value for Report number of paths is 10, otherwise, the report can be very long. Enable Pairs only to list only one path for each pair of source and destination. Limit further with Maximum number of paths per endpoints. You can also filter paths by entering a value in the Maximum slack limit field. |
| Report Number of Neighbor Paths | Specifies the number of neighbor paths to report, allowing you to view a number of the top adjacent paths entering the critical path, and the top paths exiting the critical path. |
| Report panel name | Specifies the name of the report panel. You can optionally enable File name to write the information to a file. If you append .htm or .html as a suffix, the Timing Analyzer produces the report as HTML. If you enable File name, you can Overwrite or Append the file with latest data. |
| Tcl command | Displays the Tcl syntax that corresponds with the GUI options you select. You can copy the command from the Console into a Tcl file. |
| Extra Info | Specifies extra info. |