Developer Guide
FPGA Optimization Guide for Intel® oneAPI Toolkits
A newer version of this document is available. Customers should click here to go to the newest version.
Visible to Intel only — GUID: GUID-7FE35F42-F8FE-4847-AA1A-F526165F93D6
Visible to Intel only — GUID: GUID-7FE35F42-F8FE-4847-AA1A-F526165F93D6
Profiler Analyses of Example SYCL* Design Scenarios
Understanding the problems and solutions presented in example SYCL design scenarios might help you leverage the Profiler metrics of your design to optimize its performance.
High Stall Percentage
A high stall percentage implies that the memory or pipe instruction cannot fulfill the access request because of contention for memory bandwidth or pipe buffer space.
Memory instructions stall often whenever bandwidth usage is inefficient or if a large amount of data transfer is necessary during the execution of your application. Inefficient memory accesses lead to suboptimal bandwidth utilization. In such cases, analyze your kernel memory access for possible improvements.
Pipe instructions stall whenever there is a strong imbalance between read and write accesses to the pipe. Imbalances might be caused by pipe reads or writes operating at different rates.
For example, if you find that the stall percentage of a write pipe call is high, check to see if the occupancy and activity of the read pipe call are low. If they are, the kernel's speed controlling the read pipe call is too slow compared to the kernel controlling the write pipe call, leading to a performance bottleneck.
Low Occupancy Percentage
A low occupancy percentage implies that a work-item is accessing the load and store operations or the pipe infrequently. This behavior is expected for load and store operations or pipes that are in non-critical loops. However, if the memory or pipe instruction is in critical portions of the kernel code and the occupancy or activity percentage is low, it implies that a performance bottleneck exists because work-items or loop iterations are not being issued in the hardware.
Consider the following code example:
queue_event = deviceQueue.submit([&](handler &cgh) {
   cgh.single_task<class LowOccupancyPercentageEx>([=]() {
      for (int i = 0; i < N; i++) {
         for (int j = 0; j < 1000; j++){
            Pipe1::write(data1);
         }
         for (int k =0; k < 3; k++) {
            Pipe2::write(data2);
         }
      }
   });
});
Assuming all loops are pipelined, the first inner loop with a trip count of 1000 is the critical loop. The second inner loop with a trip count of three is executed infrequently. As a result, you can expect that the occupancy and activity percentages for Pipe1 are high and for Pipe2 are low.
In addition, occupancy percentage might be low if you define a small work-group size, the kernel might not receive sufficient work-items. This is problematic because the pipeline is generally empty for the duration of kernel execution, which leads to poor performance.
High Stall and High Occupancy Percentages
A load and store operation or pipe with a high stall percentage is the cause of the kernel pipeline stall.
An ideal kernel pipeline condition has a stall percentage of 0% and an occupancy percentage of 100%.
Usually, the sum of stall and occupancy percentages approximately equals 100%. If a load and store operation or pipe has a high stall percentage, it means that the load and store operation or pipe has the ability to execute every cycle but is generating stalls.
Solutions for stalling global load and store operations:
- Use local memory to cache data.
- Reduce the number of times you read the data.
- Improve global memory accesses:
- Change the access pattern for more global-memory-friendly addressing (for example, change from stride accessing to sequential accessing).
- Compile your kernel with the -Xsno-interleaving=default compiler command option and separate the read and write buffers into different DDR banks.
- Have fewer but wider global memory accesses.
- Acquire an accelerator board with more bandwidth (for example, a board with three DDRs instead of two DDRs).
Solution for stalling local load and store operations:
- Review the Memory Viewer report to verify the local memory configuration and modify the configuration to make it stall-free.
Solutions for stalling pipes:
- Fix stalls on the other side of the pipe. For example, if a pipe read stalls, it means that the writer to the pipe is not writing data into the pipe fast enough, and you must adjust it.
- If there are pipe loops in your design, specify the pipe depth.
No Stalls, Low Occupancy Percentage, and Low Bandwidth
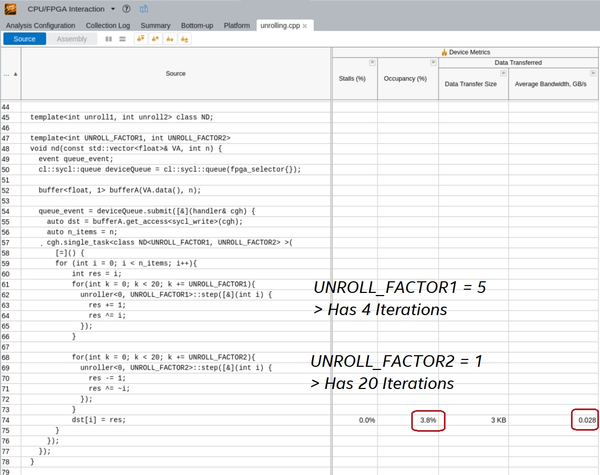
Loop-carried dependencies might create a bottleneck in your design that causes an LSU to have a low occupancy percentage and a low bandwidth.
An ideal kernel pipeline has a bandwidth that equals the board's available bandwidth.

In this example, dst[] is executed once every 20 iterations of the FACTOR2 loop and once every four iterations of the FACTOR1 loop. Therefore, FACTOR2 loop is the source of the bottleneck.
Solutions for resolving loop bottlenecks:
- Unroll the FACTOR1 and FACTOR2 loops evenly. Simply unrolling FACTOR1 loop further does not resolve the bottleneck.
- Vectorize your kernel to allow multiple work-items to execute during each loop iteration.
No Stalls, High Occupancy Percentage, and Low Bandwidth
The structure of a kernel design might prevent it from leveraging all the available bandwidth that the accelerator board can offer.

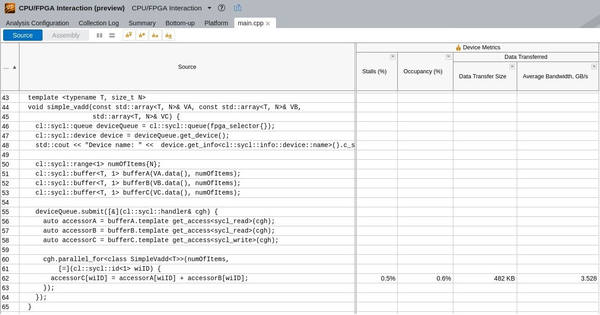
In this example, the accelerator board can provide a bandwidth of 25600 megabytes per second (MB/s). However, the vector_add kernel is requesting (2 reads + 1 write) x 4 bytes x 294 MHz = 12 bytes/cycle x 294 MHz = 3528 GB/s, which is 14% of the available bandwidth. To increase the bandwidth, increase the number of tasks performed in each clock cycle.
Solutions for low bandwidth:
- Automatically or manually, vectorize the kernel to make wider requests.
- Unroll the innermost loop to make more requests per clock cycle.
- Delegate some of the tasks to another kernel.
High Stall and Low Occupancy Percentages
There might be situations where a global store operation might have a high stall percentage (for example, 30%) and very low occupancy percentage (for example, 0.01%). If such a store operation happens once every 10000 cycles of computation, the efficiency of this store is likely not a cause for concern.