Visible to Intel only — GUID: ssf1715705128098
Ixiasoft
1.1. Compilation Overview
1.2. Design Analysis & Elaboration
1.3. Design Synthesis
1.4. Design Place and Route
1.5. Incremental Optimization Flow
1.6. Fast Forward Compilation Flow
1.7. Full Compilation Flow
1.8. HSSI Dual Simplex IP Generation Flow
1.9. Exporting Compilation Results
1.10. Clearing Compilation Results
1.11. Integrating Other EDA Tools
1.12. Compiler Optimization Techniques
1.13. Compilation Monitoring Mode
1.14. Viewing Quartus Database File Information
1.15. Understanding the Design Netlist Infrastructure
1.16. Using Synopsys* Design Constraint (SDC) on RTL Files
1.17. Using the Node Finder
1.18. Synthesis Language Support
1.19. Synthesis Settings Reference
1.20. Fitter Settings Reference
1.21. Design Compilation Revision History
2.1. Factors Affecting Compilation Results
2.2. Strategies to Reduce the Overall Compilation Time
2.3. Reducing Synthesis Time
2.4. Reducing Placement Time
2.5. Reducing Routing Time
2.6. Reducing Static Timing Analysis Time
2.7. Setting Process Priority
2.8. Reducing Compilation Time Revision History
Visible to Intel only — GUID: ssf1715705128098
Ixiasoft
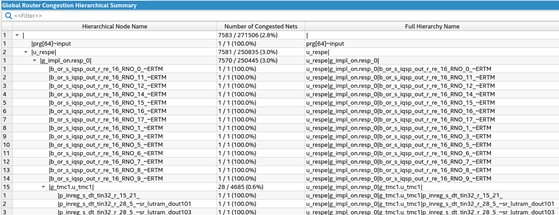
2.5.1.1. Identifying Congestion with the Global Router Congestion Hotspot Summary Report and the Global Router Wire Utilization Map
The Global Router Congestion Hotspot Summary report, accessible in the Route Stage Reports, identifies congested net hotspots within the design by hierarchical node name. This report presents a ratio:
Figure 151. Example Global Router Congestion Hotspot Summary Report
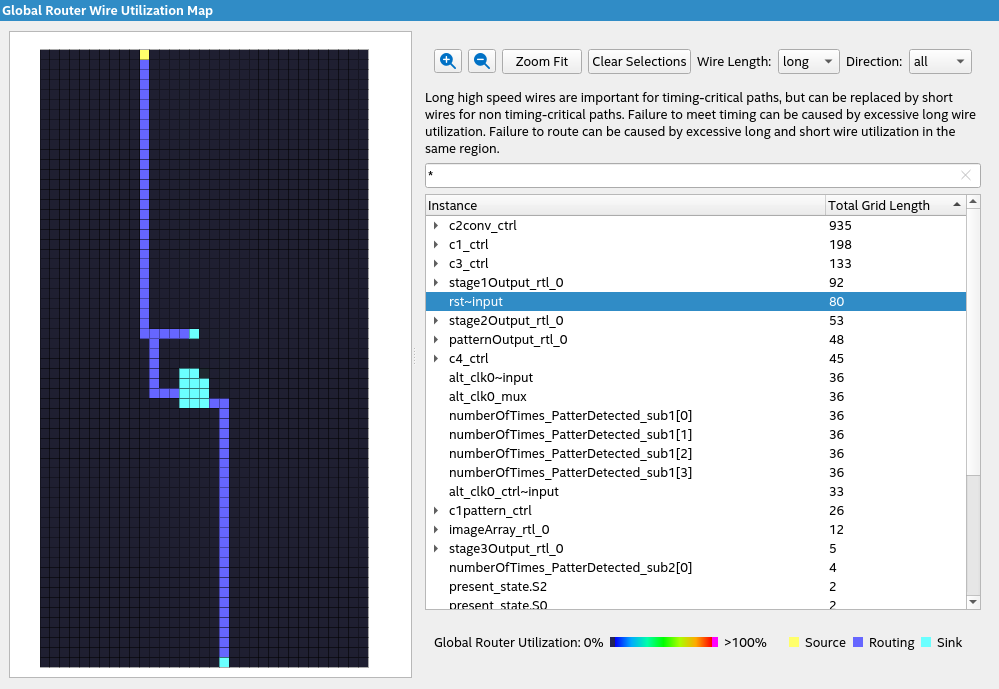
The Global Router Wire Utilization Map offers a visual representation of the Global Router Congestion Hotspot Summary Report, presenting global signal routing via an interactive heat-map. The map illustrates the routing utilization rate of both long and short routing wires, offering a detailed view of all nets in the design. The heatmap grid corresponds to the LABs available in the device, with color ranging from blue to red, indicating routing utilization rates from 0% to 100%. Pink color denotes utilization rates exceeding 100%.
Routing utilization can exceed 100% in the Global Router reports, because the reports are generated near the beginning of the routing process. As the router runs, it attempts to resolve areas of overuse to bring them at or below 100% utilization. If the router is unable to bring routing utilization below 100% in any part of the design, the compilation fails.
In the Chip Planner Routing Utilization report, there is also a color gradient that shows blue to red, with pink for exceeding the threshold. However, you can adjust the threshold in Chip Planner, so pink in Chip Planner Routing Utilization reports does not indicate utilization only over 100%, but utilization above the a user-selected threshold.
Filter the Global Router Wire table to display short or long wire length in all directions, adjusting the table content based on heatmap selections. You can search for signal names. Selected signal names display their properties in the lower pane.
Figure 152. Example Global Router Wire Utilization Map
Utilize the insights provided by the Global Router Congestion Hotspot Summary report and the Global Router Wire Utilization Map to pinpoint areas requiring further optimization. For instance, in cases where nets with high fan-outs traverse significant distances, consider manually duplicating the sources of these influential signals to create a tree-like structure of registers. As the signals propagate down the tree, they feed into local copies of the original source, reducing overall travel distance.
Additionally, employ Logic Lock regions to constrain logic modules to specific areas of the device. These regions enable the definition of arbitrary regions within the device to accommodate specific design modules, facilitating the relocation of non-critical logic away from congested areas. For more information about Logic Lock regions, refer to " Defining Logic Lock Placement Constraints " in Intel Quartus Prime Pro Edition User Guide: Design Optimization .
For more techniques to reduce congestion or how to improve timing in your design, refer to Intel Quartus Prime Pro Edition User Guide: Design Optimization .