Developer Guide
Intel® oneAPI DPC++/C++ Compiler Handbook for FPGAs
A newer version of this document is available. Customers should click here to go to the newest version.
Visible to Intel only — GUID: GUID-70D4B657-4297-4D9B-ACAF-85C1028F861E
Visible to Intel only — GUID: GUID-70D4B657-4297-4D9B-ACAF-85C1028F861E
Set Up the Intercept Layer for OpenCL™ Applications
The Intercept Layer for OpenCL™ Applications is available on GitHub* at https://github.com/intel/opencl-intercept-layer
To set up the Intercept Layer for OpenCL Applications, perform the following steps:
- Download Intercept Layer for OpenCL Applications version 2.2.1 or later from GitHub* at the following URL:
- Build the Intercept Layer according to the instructions provided in How to Build the Intercept Layer for OpenCL™ Applications.
- Ensure that you have set ENABLE_CLILOADER=1 when running cmake command. For example, run cmake -DENABLE_CLILOADER=1 ...
- Run the make command in the build directory. This step builds the cliloader loader utility.
The cliloader executable should now exist in the <path to opencl-intercept-layer-master download>/<build dir>/cliloader/ directory.
- Add the directory to your PATH environment variable if you want to run multiple designs using cliloader.
You can now pass your executables to cliloader to run them with the intercept layer. For details about the cliloader loader utility, see cliloader: A Intercept Layer for OpenCL™ Applications Loader.
- Set cliloader and other Intercept Layer options.
If you run multiple designs with the same options, set up a clintercept.conf file in your home directory. You can also set the options as environment variables by prefixing the option name with CLI_. For example, the DllName option can be set through the CLI_DllName environment variable. For a list of options, see Controls in How to Use the Intercept Layer for OpenCL Applications.
Option/Variable Description DllName=$CMPLR_ROOT/linux/lib/libOpenCL.so The intercept layer must know where libOpenCL.so file from the original oneAPI build is. DevicePerformanceTiming=1 and DevicePerformanceTimelineLogging=1 These options print out runtime timeline information in the output of the executable run. ChromePerformanceTiming=1, ChromeCallLogging=1, ChromePerformanceTimingInStages=1 These variables set up the chrome tracer output and ensure the output has Queued, Submitted, and Execution stages.
These instructions set up the cliloader executable, which provides some flexibility by allowing for more control over when the layer is used or not used. If you prefer a local installation (for a single design) or a global installation (always ON for all designs), follow the instructions at How to Install the Intercept Layer for OpenCL Applications.
When you run the host executable with cliloader <executable> [executable args] command, the stderr output contains lines as shown in the following example:
Device Timeline for clEnqueueWriteBuffer (enqueue 1) = 63267241140401 ns (queued),
63267241149579 ns (submit), 63267241194205 ns (start), 63267242905519 ns (end)
These lines give the timeline information about a variety of oneAPI runtime calls. After the host executable finishes running, there is also a summary of the performance information for the run. After the executable runs, the data collected is placed in the CLIntercept_Dump directory, which is in the home directory by default. Its location can be adjusted using the DumpDir=<directory where you want the output files> cliloader option. The CLIntercept_Dump directory contains a file called clintercept_trace.json. You can load this JSON file in the Google* Chrome trace event profiling tool (chrome://tracing/) to visualize the timeline data collected by the run.
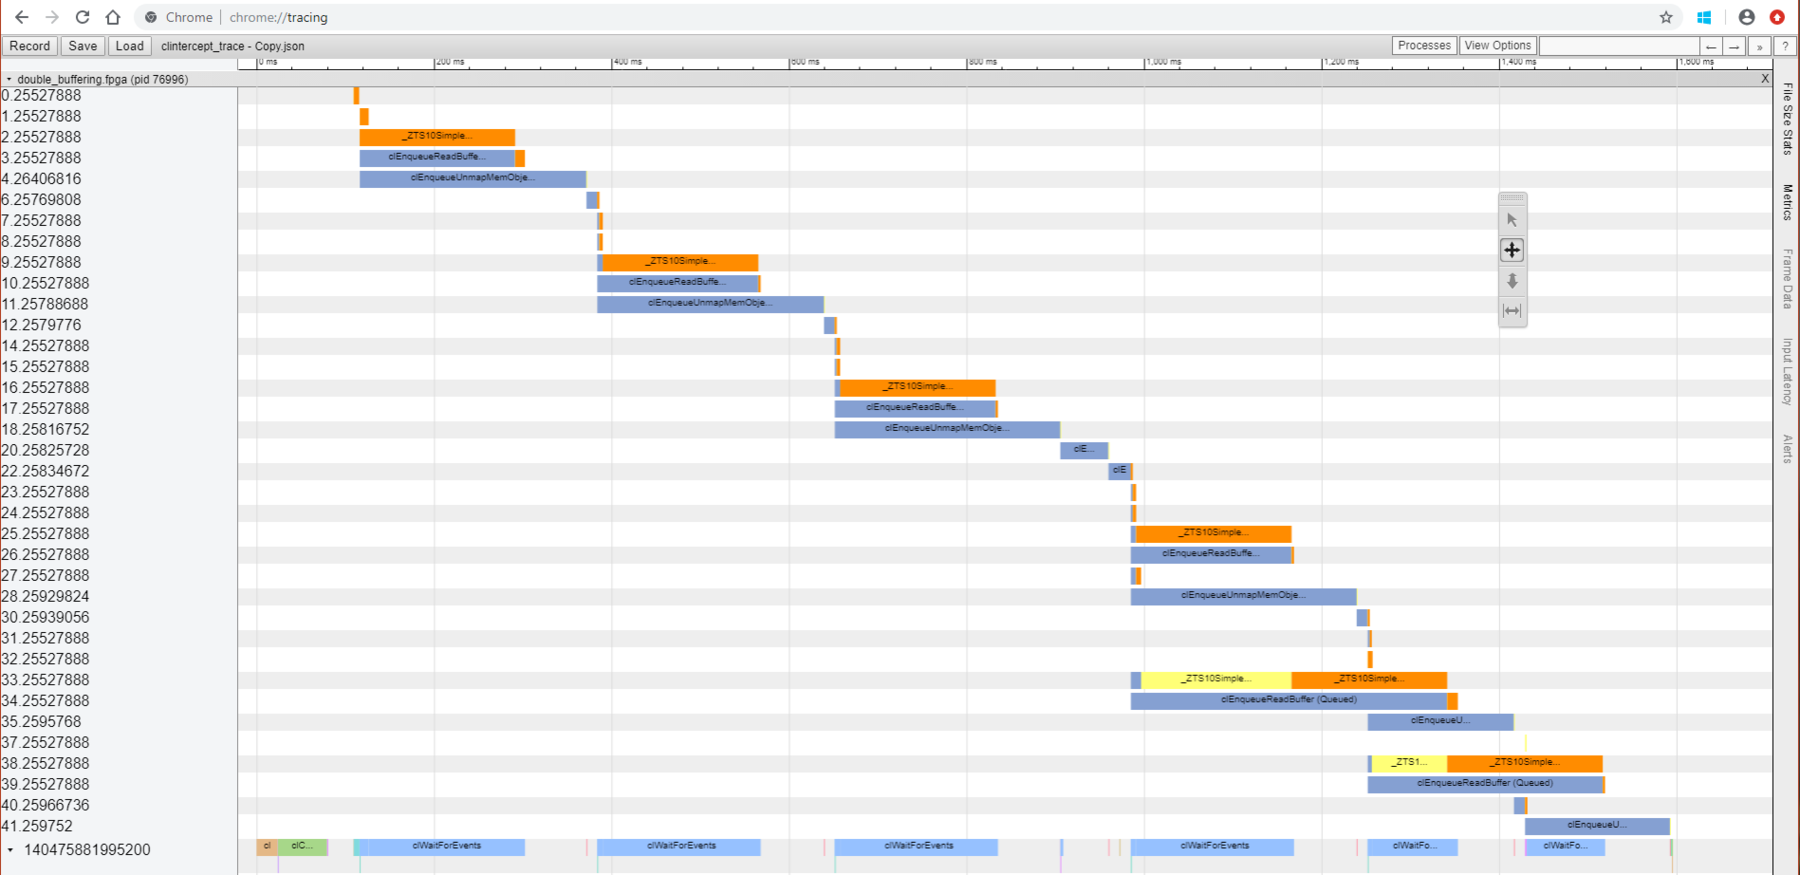
The following is a sample visualization of timeline data:

This visualization shows different calls executed through time. The X-axis is time, with the scale shown near the top of the page. The Y-axis shows different calls that are split up in several ways.
The left side (Y-axis) has two different types of numbers:
- Numbers that contain a decimal point.
- The part of the number before the decimal point orders the calls approximately by start time.
- The part of the number after the decimal point represents the queue number the call was made in.
- Numbers that do not contain a decimal point. These numbers represent the thread ID of the thread being run on in the operating system.
The colors in the trace represent different stages of execution:
- Blue during the queued stage.
- Yellow during the submitted stage.
- Orange for the execution stage.
Identify gaps between consecutive execution stages and kernel runs to identify possible areas for optimization.
For an example use of Intercept Layer for OpenCL Applications, see Analyzing Buffering Using the Intercept Layer for OpenCL™ Applications.