Visible to Intel only — GUID: GUID-CEC9C6D9-1C56-4295-8FD0-76362E411029
Intel oneAPI DPC++/C++ Compiler Handbook for FPGAs Overview
Introduction To FPGA Design Concepts
Intel oneAPI FPGA Development
Getting Started with the Intel oneAPI DPC++/C++ Compiler for Intel FPGA Development
Defining a Kernel for FPGAs
Debugging and Verifying Your Design
Analyzing Your Design
Optimizing Your Kernel
Optimizing Your Host Application
Integrating Your Kernel into DSP Builder for Intel FPGAs
Integrating Your RTL IP Core Into a System
RTL IP Core Kernel Interfaces
Loops
Pipes
Data Types and Arithmetic Operations
Parallelism
Memories and Memory Operations
Libraries
Additional FPGA Acceleration Flow Considerations
FPGA Optimization Flags, Attributes, Pragmas, and Extensions
Quick Reference
Additional Information
Document Revision History for the Intel oneAPI DPC++/C++ Compiler Handbook for Intel FPGAs
Notices and Disclaimers
Set the Environment Variables and Launch Visual Studio* Code
Create an FPGA Visual Studio* Code Project
Enable Code Completion in a Visual Studio* Code Project
Configure Running and Debugging in a Visual Studio* Code Project
Debugging Your Kernel in Visual Studio* Code with a Native Debugger
Generate and View the FPGA Optimization Report
Build and Run the FPGA Hardware Image
Throughput
Resource Use
System-level Profiling Using the Intercept Layer for OpenCL™ Applications
Multithreaded Host Application
Utilizing Hardware Kernel Invocation Queue
Double Buffering Host Utilizing Kernel Invocation Queue
N-Way Buffering to Overlap Kernel Execution
Prepinning Memory
Simple Host-Device Streaming
Buffered Host-Device Streaming
Refactor the Loop-Carried Data Dependency
Relax Loop-Carried Dependency
Transfer Loop-Carried Dependency to Local Memory
Minimize the Memory Dependencies for Loop Pipelining
Unroll Loops
Fuse Loops to Reduce Overhead and Improve Performance
Optimize Loops With Loop Speculation
Remove Loop Bottlenecks
Improve fMAX/II with Shannonization
Optimize Inner Loop Throughput
Improve Loop Performance by Caching Data in On-Chip Memory
Global Memory Bandwidth Use Calculation
Manual Partition of Global Memory
Partitioning Buffers Across Different Memory Types (Heterogeneous Memory)
Partitioning Buffers Across Memory Channels of the Same Memory Type
Ignoring Dependencies Between Accessor Arguments
Contiguous Memory Accesses
Static Memory Coalescing
Specify Schedule fMAX Target for Kernels (-Xsclock=<clock target>)
Create a 2xclock Interface (-Xsuse-2xclock)
Disable Burst-Interleaving of Global Memory (-Xsno-interleaving)
Force Ring Interconnect for Global Memory (-Xsglobal-ring)
Force a Single Store Ring to Reduce Area (-Xsforce-single-store-ring)
Force Fewer Read Data Reorder Units to Reduce Area (-Xsnum-reorder)
Disable Hardware Kernel Invocation Queue (-Xsno-hardware-kernel-invocation-queue)
Modify the Handshaking Protocol Between Clusters (-Xshyper-optimized-handshaking)
Disable Automatic Fusion of Loops (-Xsdisable-auto-loop-fusion)
Fuse Adjacent Loops With Unequal Trip Counts (-Xsenable-unequal-tc-fusion)
Pipeline Loops in Non-task Kernels (-Xsauto-pipeline)
Control Semantics of Floating-Point Operations (-fp-model=<value>)
Modify the Rounding Mode of Floating-point Operations (-Xsrounding=<rounding_type>)
Global Control of Exit FIFO Latency of Stall-free Clusters (-Xssfc-exit-fifo-type=<value>)
Enable the Read-Only Cache for Read-Only Accessors (-Xsread-only-cache-size=<N>)
Control Hardware Implementation of the Supported Data Types and Math Operations (-Xsdsp-mode=<option>)
Generate Register Map Wrapper (-Xsregister-map-wrapper-type)
Allow Wide Memory Initialization (-Xsallow-wide-device-globals)
Specify Schedule fMAX Target for Kernels (scheduler_target_fmax_mhz)
Specify a Workgroup Size (max_work_group_size/reqd_work_group_size)
Specify Number of SIMD Work Items (num_simd_work_items)
Omit Hardware that Generates and Dispatches Kernel IDs (max_global_work_dim)
Omit Hardware that Supports Global Work Offsets (no_global_work_offset)
Reduce Kernel Area and Latency (use_stall_enable_clusters)
Visible to Intel only — GUID: GUID-CEC9C6D9-1C56-4295-8FD0-76362E411029
Review the FPGA Optimization Report
The FPGA optimization report provides suggestions on how you can modify kernels to increase performance. For compiler commands to generate the report, refer to the FPGA Compilation Flags.
Navigate to the <project_dir>/reports/ directory and review one of the following files of your application to determine whether the estimated kernel performance data is acceptable. Both options display the same report:
- report.html: You can view this file using Internet browsers, such as Microsoft* Edge, Google* Chrome, or Mozilla* Firefox.
- <design_name>.zip: Use the Intel® oneAPI FPGA Reports tool report.html as described in the following sections to view the optimization reports:
Launching the Intel® oneAPI FPGA Reports Tool
The Intel oneAPI FPGA Reports Tool is a generic report.html file from which you can open the <design_name>.zip file for any design. Use the Intel oneAPI FPGA Reports Tool to navigate between multiple reports quickly and easily, while needing to bookmark only one report.html file in your chosen Internet browser.
The Intel oneAPI FPGA Reports tool is installed as part of the FPGA Support Package for the Intel® oneAPI DPC++/C++ Compiler.
Run the oneAPI setvars (or oneapi-vars) script to have the fpga_report command added to your PATH environment variable.
On a Linux system, invoke the fpga_report command on the command-line interface. The command reports the path to the Intel oneAPI FPGA Reports Tool report.html file, which you can then open in a supported web browser.
On a Windows system, invoke the fpga_report.exe command from the Intel® oneAPI Base Toolkit install path. The command opens the Intel oneAPI FPGA Reports Tool report.html file in your default web browser.
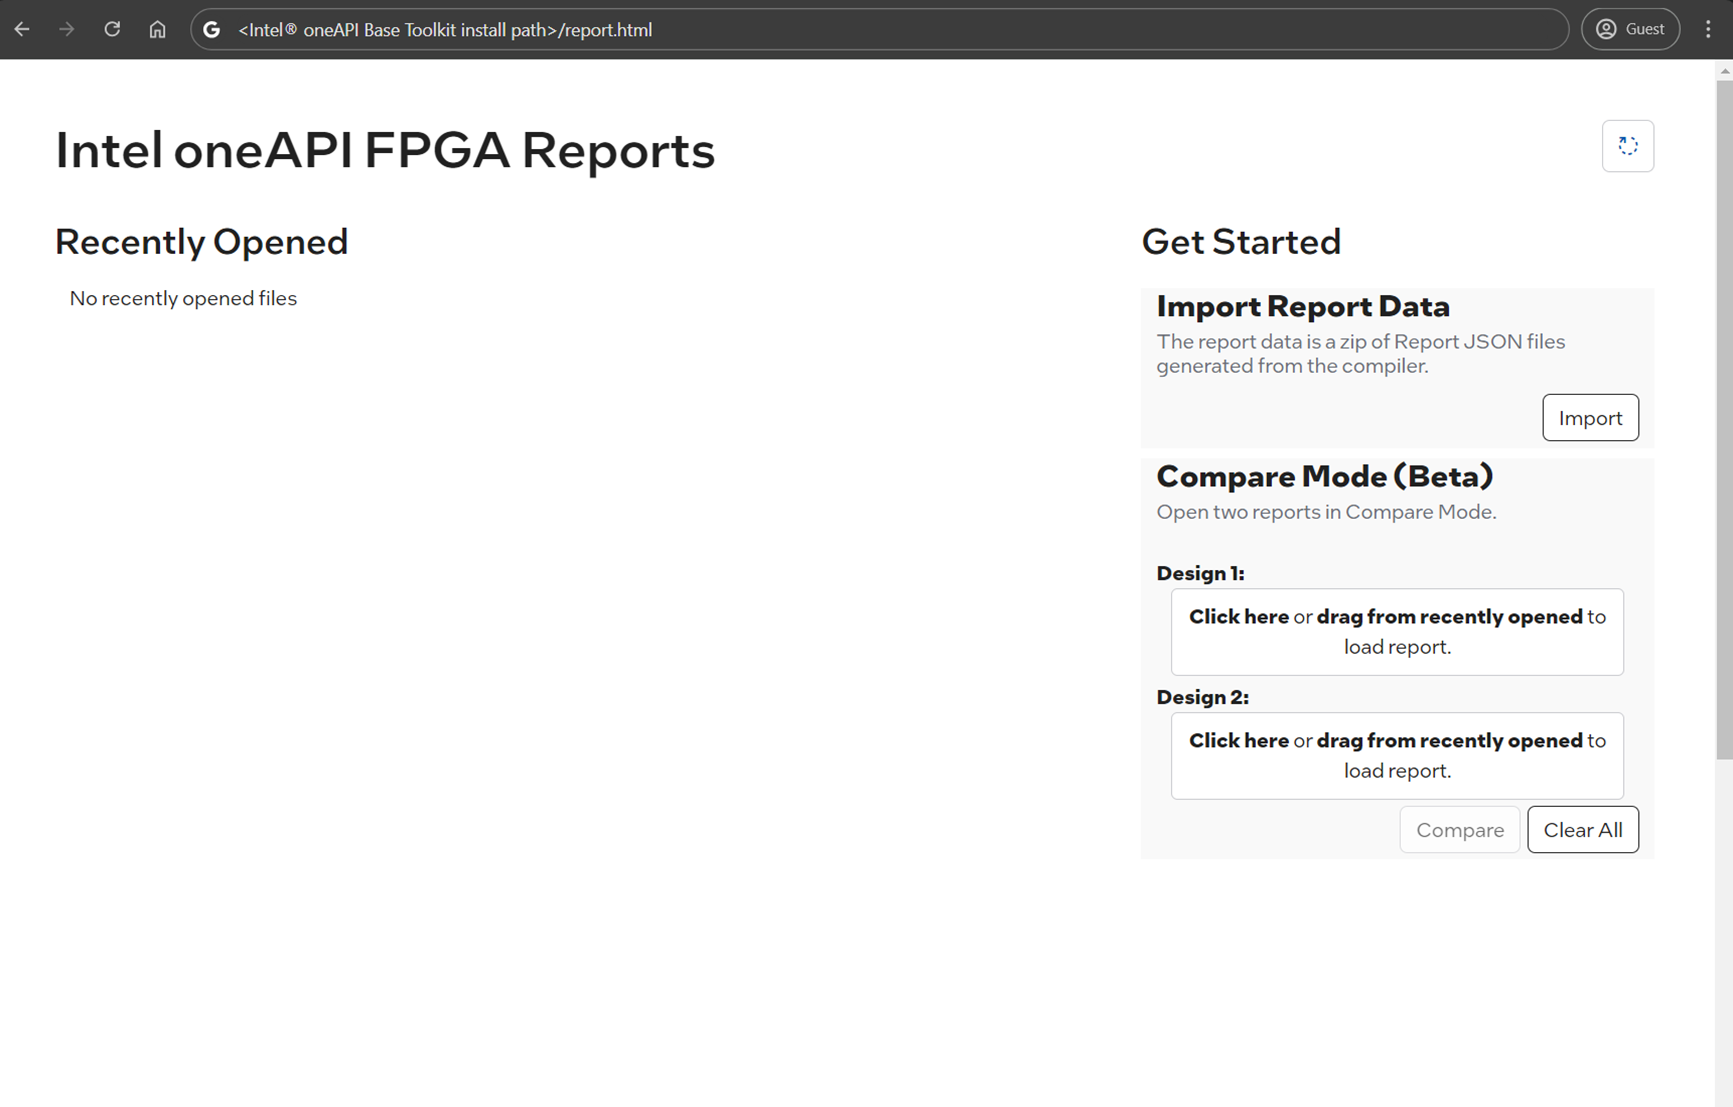
The initial page of the Intel oneAPI FPGA Reports Tool report.html file displays a menu as shown in the following image:
Intel® oneAPI FPGA Reports Tool
Loading Your Design Optimization Report
Load a design optimization report by importing it into the Intel® oneAPI FPGA Reports interface as follows:
- Go to Get Started > Import Report Data and click Import.
- Navigate to the <project_dir>/reports/ directory.
- Select the <design_name>.zip file.
- Click Open. The report loads in the Intel® oneAPI FPGA Reports interface.
To open a report that you have opened previously, click the report under Recently Opened. This list is browser-specific, so reports opened in one browser are not shown in the Recently Opened list in a different browser.
RESTRICTION:
Mozilla* Firefox does not support the Recently Opened section.
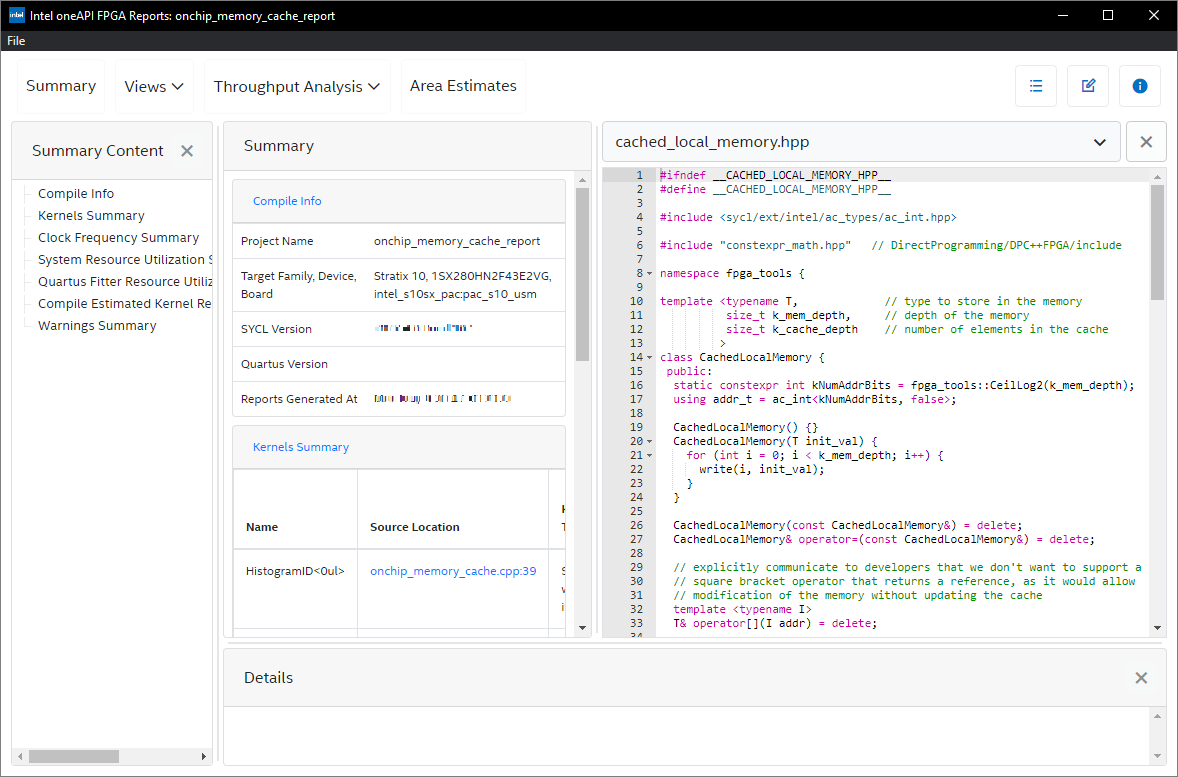
Sample Optimization Report in the Intel® oneAPI FPGA Reports Tool
Comparing Reports
Use the Intel® oneAPI FPGA Reports tool to compare two optimization reports of the same design or different designs as follows:
- Under Compare Reports > Design 1, click Click here, navigate to the <project_dir>/reports directory and select the <design_name>.zip file of the first design. You can also drag files from the Recently Opened list to the file field.
- Under Compare Reports > Design 2, click Click here, navigate to the <project_dir>/reports directory and select the <design_name>.zip file of the second design. You can also drag files from the Recently Opened list to the file field.
- Click Compare.
Comparison Mode in the Intel® oneAPI FPGA Reports Tool
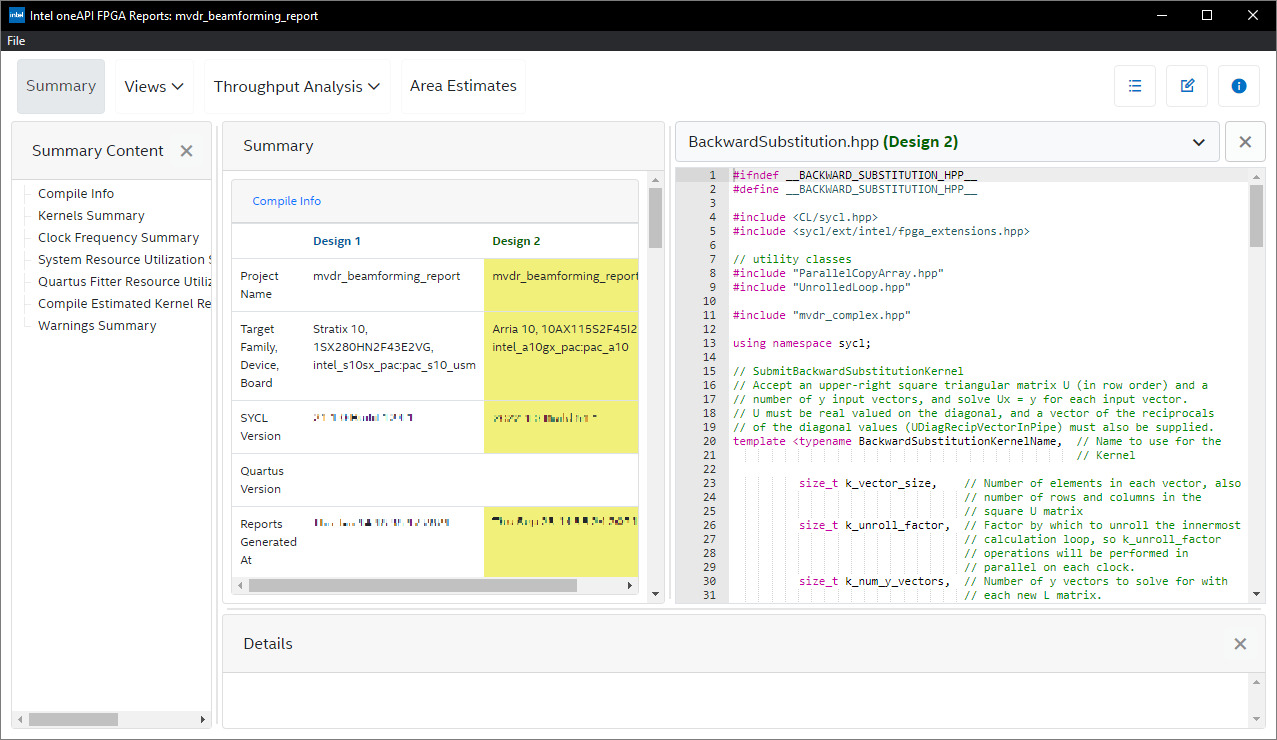
NOTE:
Currently, only the Summary View and Loop Analysis have a comparison mode. For views not supported in the comparative mode, a view for each design is generated and you can identify the designs by the Design <number> text in the view name.
Filtering Nodes in Report Tables (Linux only)
RESTRICTION:
File nodes in report tables is available only for designs that were compiled on a Linux* based operating system.
For table views in the Intel® oneAPI FPGA Reports, you can filter nodes in the table views to hide information about data that is outside of your design such as header files and third-party libraries. With a filtered view of your design, you can focus on your design with fewer distractions.
For large designs, you can filter nodes to reduce clutter in the report tables and improve the load time of report tables.
You filter nodes by choosing what source files to hide in the reports. Hiding a source file in the reports hides all the nodes that result from the hidden source file.
Data that is found in tables that provide summaries about the entire design (such as area summaries) do not remove data from hidden nodes. The summaries show information about the entire design regardless of any node filtering applied.
REMEMBER:
Only nodes seen in table views will be hidden. Node Filtering does not affect the graphical views such as System Viewer or Schedule Viewer.
To filter nodes in the table views of the reports:
- From the Summary of the report, open the Report Settings page by clicking the settings icon in the top-right corner of the view:
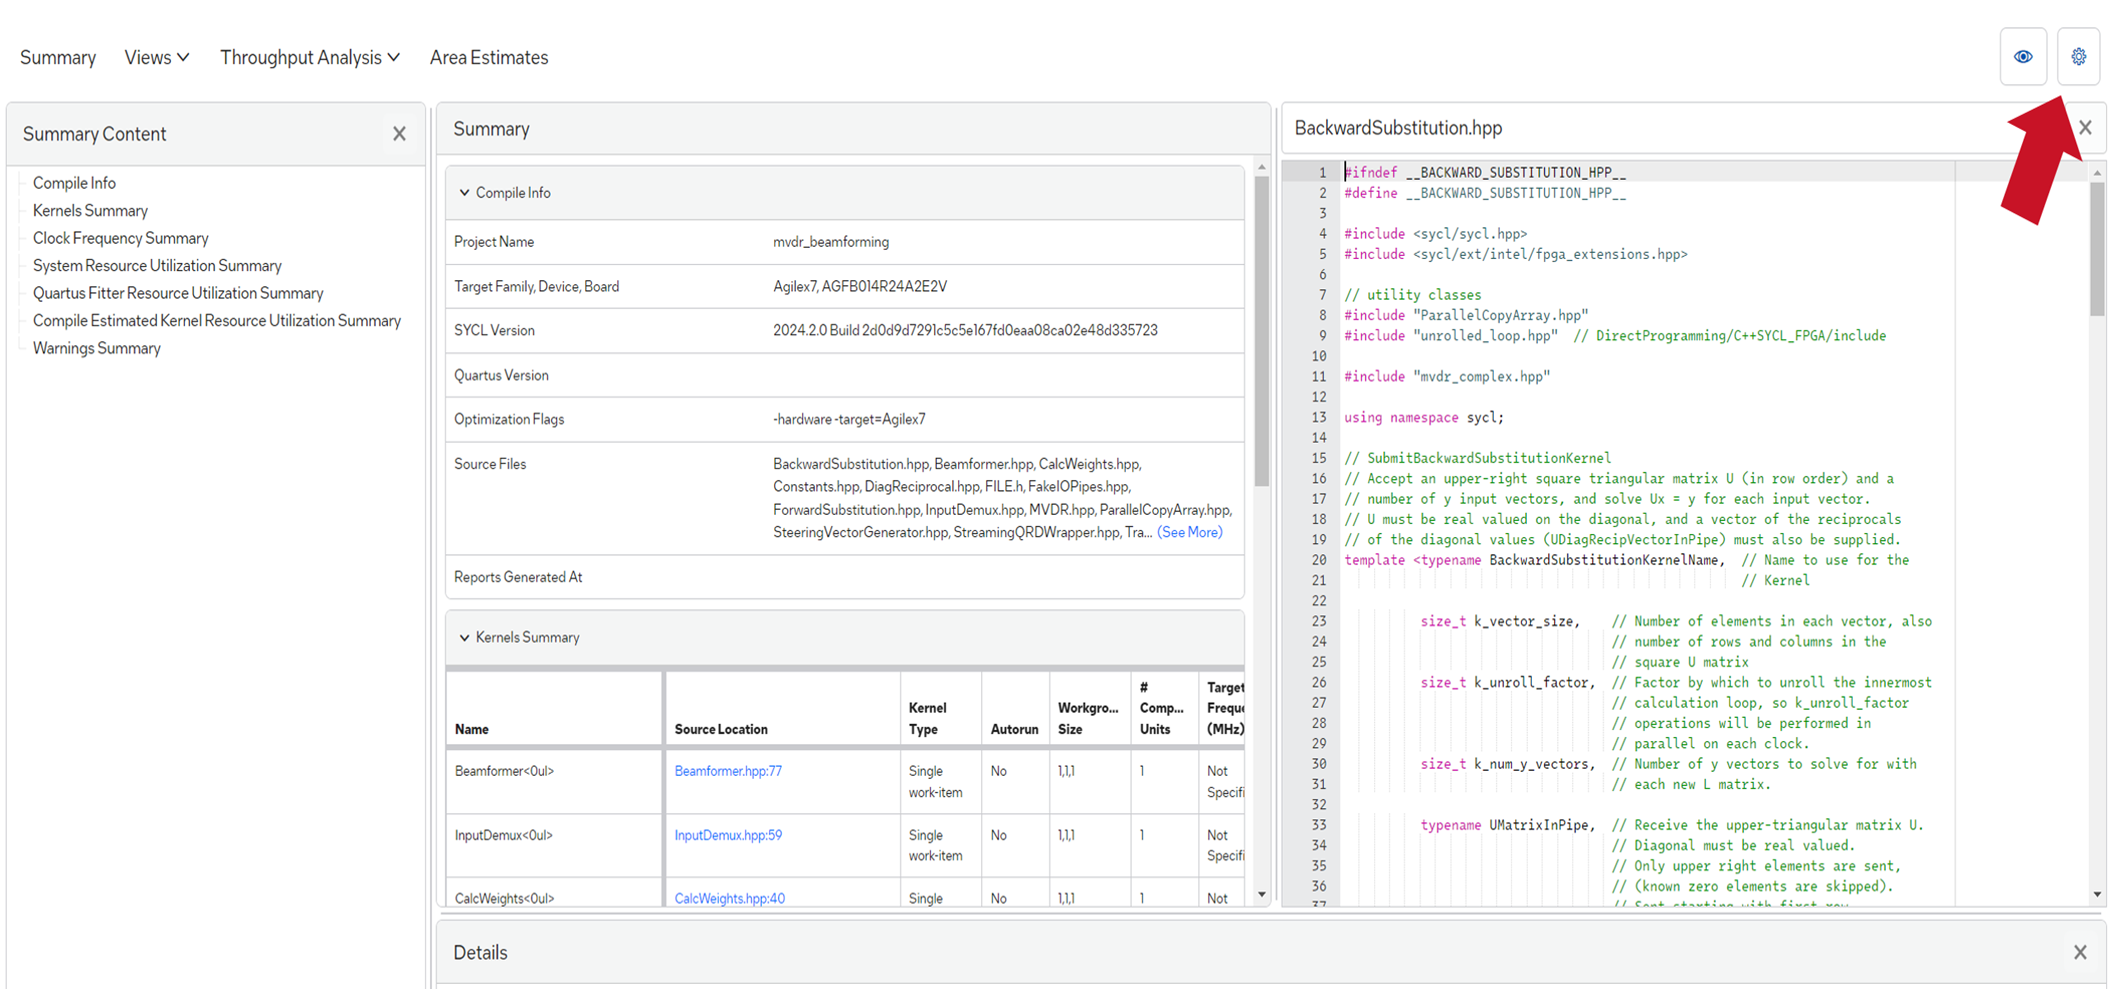
- On the Report Settings page, go to the Hide Source Files section.
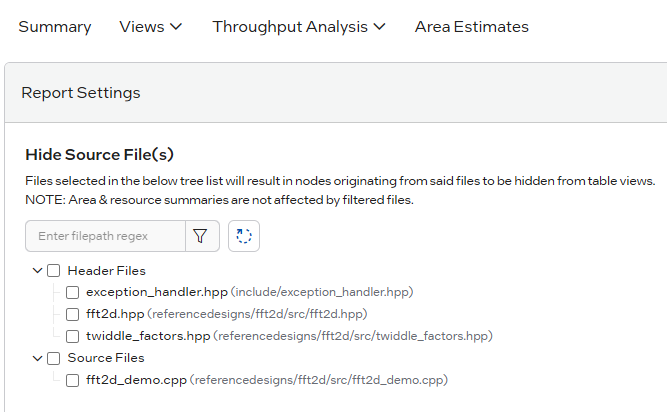
- In the Hide Source Files section, select the source files for the nodes that you want to hide in the table views. You can scroll this list of files or use the search field to filter the list file names that match a regular expression.
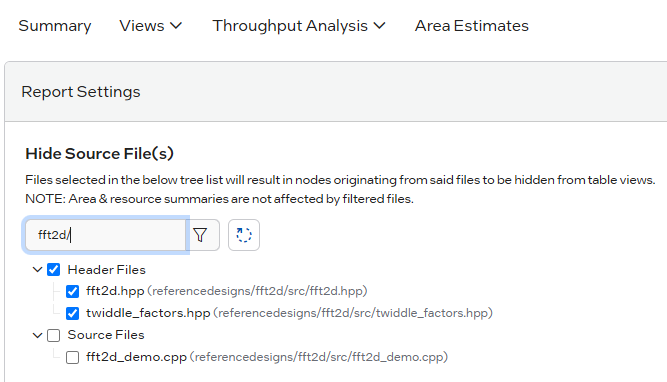
The Hide Source Files section also provides categories of source files. Select a category to hide nodes from all the source files in that category.
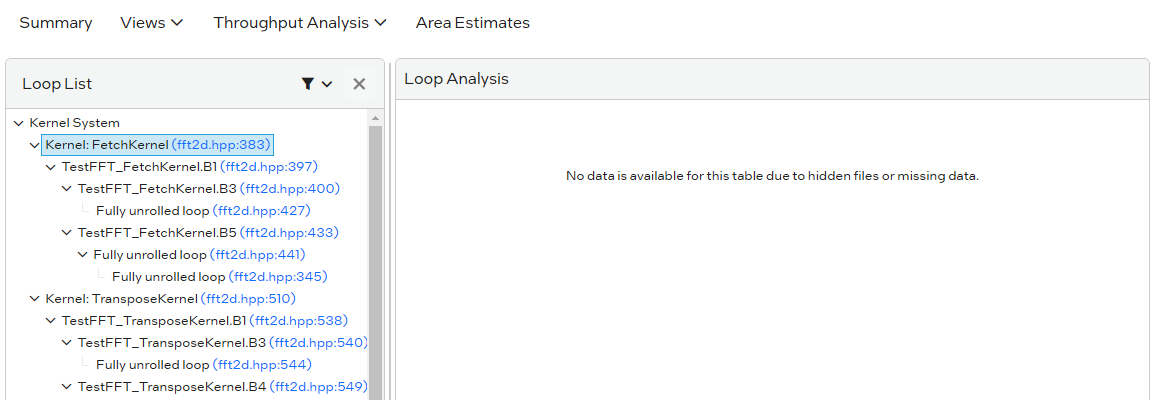
Filtered nodes can show up in navigation lists, but selecting them displays a message that indicates that the source file for the node is hidden:
Parent topic: Analyzing Your Design