A newer version of this document is available. Customers should click here to go to the newest version.
Python* Code Analysis
Explore performance analysis options provided by the Intel® VTune™ Profiler for Python* applications to identify the most time-consuming code sections and critical call paths.
VTune Profiler supports the Hotspots, Threading, and Memory Consumption analysis for Python* applications via the Launch Application and Attach to Process modes. For example, when your application does excessive numerical modeling, you need to know how effectively it uses available CPU resources. A good example of the effective CPU usage is when the calculating process spends most time executing native extension and not interpreting Python glue code.
To get the maximum performance out of your Python application, consider using native extensions, such as NumPy or writing and compiling performance critical modules of your Python project in native languages, such as C or even assembly. This will help your application take advantage of vectorization and make complete use of powerful CPU resources.
To analyze the Python code performance with the VTune Profiler and interpret data:
Configure Python Data Collection
You may use either GUI or command-line (vtune) interface to configure the VTune Profiler for analyzing the performance of your Python code.
To configure and run Python code profiling from GUI, do the following:
Click the
 Configure Analysis button on the toolbar.
 The Configure Analysis window opens.
Choose a target system and target type. For example: Local Host and Launch Application.
NOTE:Only Windows* and Linux* target systems are supported.
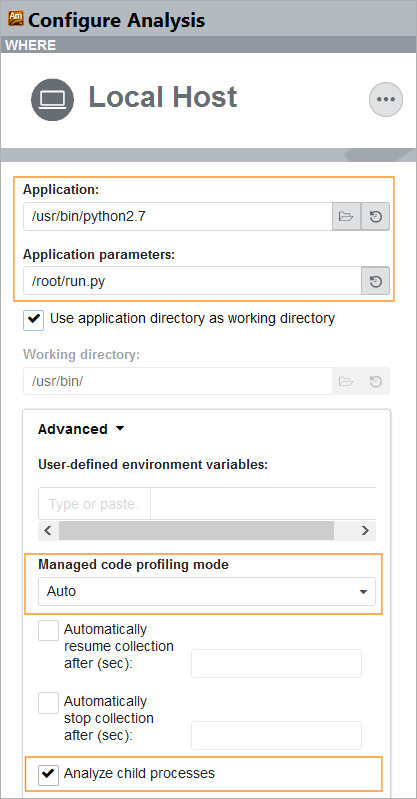
In the Launch Application configuration pane, specify a path to the installed Python interpreter in the Application field and a path to your Python script in the Application parameters field.
NOTE:If you specify a relative path to your Python script in the Application parameters field, the VTune Profiler properly resolves full function or method names only for the imported modules, and does not resolve the names inside the main script. Consider specifying the absolute path to the script.
In addition, you may select the Auto managed code profiling mode, and the VTune Profiler automatically detects the type of target executable, managed or native, and switches to the corresponding mode. Optionally, you may select Analyze child processes option to collect data on processes launched by the target process. For example, on Linux your configuration may look like this:

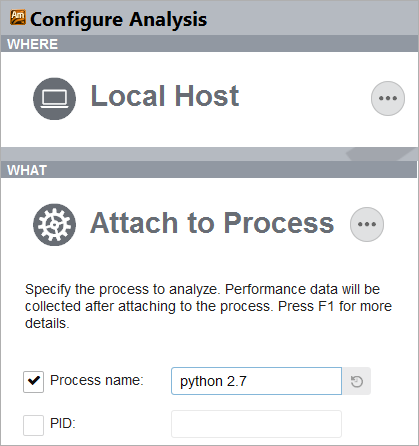
In case your Python application needs to run before the profiling starts or cannot be launched at the start of this analysis, you may attach the VTune Profiler to the Python process. To do this, select the Attach to Process target type and specify the Python process name or PID as follows:
 NOTE:
NOTE:When you attach the VTune Profiler to the Python process, make sure you initialize the Global Interpreter Lock (GIL) inside your script before you start the analysis. If GIL is not initialized, the VTune Profiler collector initializes it only when a new Python function is called.
From the HOW configuration pane on the right, select the Hotspots, Threading, or Memory Consumption analysis type.
Configure the following options, if required, or use the defaults:
User-Mode Sampling mode
Select to enable the user-mode sampling and tracing collection for hotspots and call stack analysis (formerly known as Basic Hotspots). This collection mode uses a fixed sampling interval of 10ms. If you need to change the interval, click the Copy button and create a custom analysis configuration.
Hardware Event-Based Sampling mode
Select to enable hardware event-based sampling collection for hotspots analysis (formerly known as Advanced Hotspots).
You can configure the following options for this collection mode:
CPU sampling interval, ms to specify an interval (in milliseconds) between CPU samples. Possible values for thehardware event-based sampling mode are 0.01-1000. 1 ms is used by default.
Collect stacks to enable advanced collection of call stacks and thread context switches.
NOTE:When changing collection options, pay attention to the Overhead diagram on the right. It dynamically changes to reflect the collection overhead incurred by the selected options.
Show additional performance insights check box
Get additional performance insights, such as vectorization, and learn next steps. This option collects additional CPU events, which may enable the multiplexing mode.
The option is enabled by default.
Details button
Expand/collapse a section listing the default non-editable settings used for this analysis type. If you want to modify or enable additional settings for the analysis, you need to create a custom configuration by copying an existing predefined configuration. VTune Profiler creates an editable copy of this analysis type configuration.
Click the Start button to run the analysis.
Identifying Hotspots
Hotspots analysis in the user-mode sampling mode helps identify sections of your Python code that take a long time to execute (hotspots), along with their timing metrics and call stacks. It also displays the workload distribution over threads in the Timeline pane.
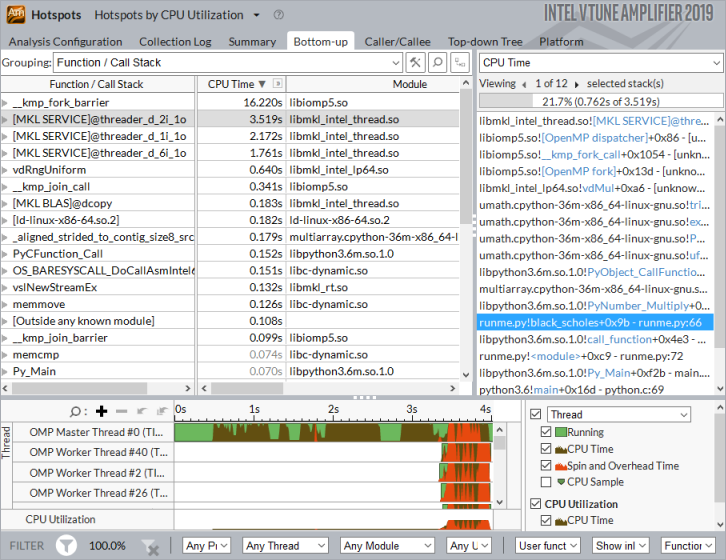
By default, the VTune Profiler uses the Auto managed code profiling mode, that enables you to view and analyze mixed stacks for Python/C++ applications. In the example below, you can see a native hotspot Intel® oneAPI Math Kernel Library(oneMKL) function on the left pane. The mixed call stack analysis on the right pane reveals a Python black_scholes function that actually calls the hotspot function:

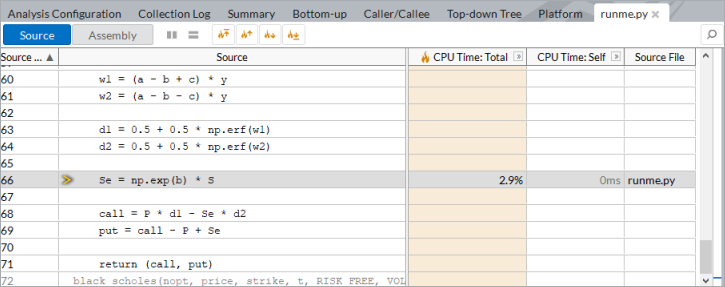
Double-click the black_scholes function on the Call Stack pane to open the source view on call site line 66:

To view call stacks only inside your Python code, filter out Python core and system functions by selecting Only user functions option for the Call Stack Mode on the filter bar.
Limitations
VTune Profiler supports Python code profiling with some limitations:
Only Python distribution 2.6 and later are supported.
If you use Python extensions that compile Python code to the native language (JIT, C/C++), the VTune Profiler may show incorrect analysis results. Consider using JIT Profiling API to solve this problem.
Python code profiling is supported for Windows and Linux target systems only.
In some cases, the VTune Profiler may not resolve full names of Python functions and modules on Windows OS. It displays correct source information, so you can view the source directly from the VTune Profiler's viewpoints.
Proper thread names are not always displayed in the Timeline pane.
If your application has very low stack depth, which includes called functions and imported modules, the VTune Profiler does not collect Python data. Consider using deeper calls to enable the profiling.
When collecting data remotely, the VTune Profiler may not resolve full function or method names, and display the source code of your Python script. To solve this problem for Linux targets, copy the source files to a directory on your host system with a path identical to the path on your target system before running the analysis.