A newer version of this document is available. Customers should click here to go to the newest version.
GPU Compute/Media Hotspots View
Use the GPU Compute/Media Hotspots viewpoint in Intel® VTune™ Profiler to analyze how your GPU-bound code is utilizing GPU and CPU resources.
Depending on the profiling mode selected for the GPU Compute/Media Hotspots analysis, you can explore your GPU-side code performance from different perspectives:
Run the analysis in Characterization mode to see performance issues for the code offloaded to the GPU:
Analyze Memory Accesses using GPU hardware events.
Run the analysis in Source Analysis mode to find the most expensive operations and explore instruction execution:
- Analyze Xe Vector Engine (XVE) Stalls
- Examine Energy Consumption by your GPU
Analyze Memory Accesses
The Characterization mode, which is enabled by default in the GPU Compute/Media Hotspots configuration, is a good entry-level analysis for GPU-bound applications.
The Hottest GPU Computing Task section of the Summary window displays the most time-consuming GPU tasks. Click on one of these tasks and see detailed information in the Graphics tab. Learn more about GPU hardware metrics (by default, the Overview set of metrics) collected for the hotspot:
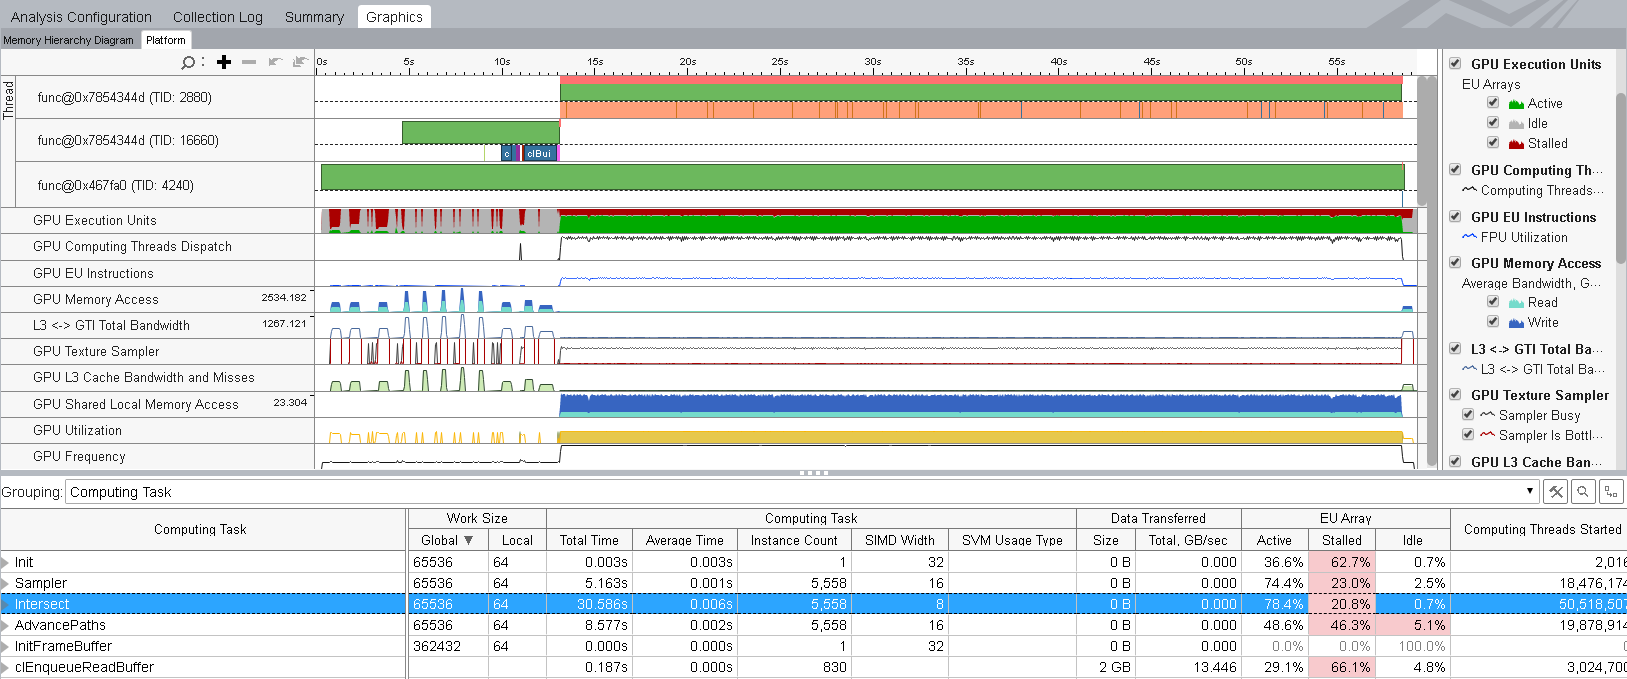
Analyze GPU Instruction Execution
If you enabled the Dynamic Instruction Count preset as part of the Characterization analysis configuration, the Graphics tab shows a breakdown of instructions executed by the kernel in the following groups:

Control Flow group |
if, else, endif, while, break, cont, call, calla, ret, goto, jmpi, brd, brc, join, halt and mov, add instructions that explicitly change the ip register. |
Send group |
send, sends, sendc, sendsc |
Synchronization group |
wait |
Int16 & HP Float | Int32 & SP Float | Int64 & DP Float groups |
Bit operations (only for integer types): and, or, xor, and others. Arithmetic operations: mul, sub, and others; avg, frc, mac, mach, mad, madm. Vector arithmetic operations: line, dp2, dp4, and others. Extended math operations: math.sin, math.cos, math.sqrt, and others. |
Other group |
Contains all other operations including nop. |
The type of an operation is determined by the type of a destination operand.
In the Graphics tab, VTune Profiler also provides the SIMD Utilization metric. This metric helps identify kernels that underutilize the GPU by producing instructions that cause thread divergence. A common cause of low SIMD utilization is conditional branching within the kernel, since the threads execute all of the execution paths sequentially, with each thread executing one path while the other threads are stalled.
To get additional information, double-click the hottest function to open the source view. Enable both the Source and Assembly panes to get a side-by-side view of the source code and the resulting assembly code. You can then locate the assembly instructions with low SIMD Utilization values and map them to specific lines of code by clicking on the instruction. This allows you to determine and optimize the kernels that do not meet your desired SIMD Utilization criteria.

Analyze Source
In the Source Analysis mode for the GPU Compute/Media Hotspots analysis, you can analyze a kernel of interest for basic block latency or memory latency issues. To do this, in the Graphics tab, expand the kernel node and double-click the function name. VTune Profiler redirects you to the hottest source line for the selected function:
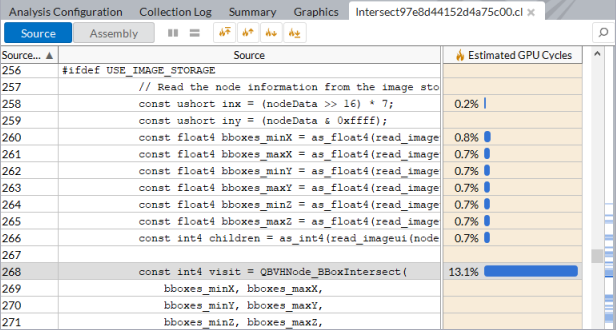
The GPU Compute/Media Hotspots analysis provides a full-scale analysis of the kernel source per code line. The hottest kernel code line is highlighted by default.
To view the performance statistics on GPU instructions executed per kernel instance, switch to the Assembly view:
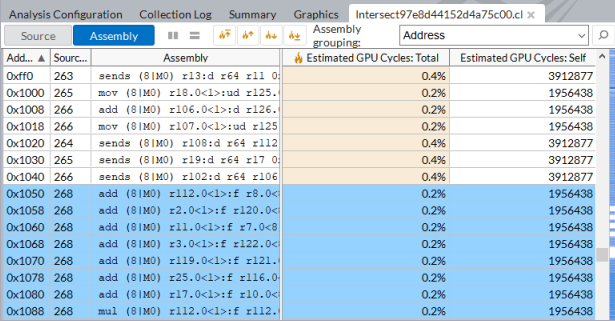
If your OpenCL kernel uses inline functions, make sure to enable the Inline Mode on the filter toolbar to have a correct attribution of the GPU Cycles per function. See examples.
Example: Basic Block Latency Profiling
You have an OpenCL kernel that performs compute operations:
__kernel void viete_formula_comp(__global float* data)
{
    int gid = get_global_id(0);
    float c = 0, sum = 0;

    for (unsigned i = 0; i < 50; ++i)
    {
            float t = 0;
            float p = (i % 2 ? -1 : 1);
            p /= i*2 + 1;
            p /= pown(3.f, i);
            p -=c;

            t = sum + p;
            c = (t - sum) - p;
            sum = t;
    }
    data[gid] = sum * sqrt(12.f);
}
To compare these operations, run the GPU In-kernel profiling in the Basic block latency mode and double-click the kernel in the grid to open the Source view:

The Source view analysis highlights the pown() call as the most expensive operation in this kernel.
Example: Memory Latency Profiling
You have an OpenCL kernel that performs several memory reads (lines 14, 15 and 20):
 __kernel void viete_formula_mem(__global float* data)
{
    int gid = get_global_id(0);
    float c = 0;

    for (unsigned i = 0; i < 50; ++i)
    {
            float t = 0;
            float p = (i % 2 ? -1 : 1);
            p /= i*2 + 1;
            p /= pown(3.f, i);
            p -=c;

            t = data[gid] + p;
            c = (t - data[gid]) - p;

            data[gid] = t;
    }
    data[gid] *= sqrt(12.f);
}
To identify which read instruction takes the longest time, run the GPU In-kernel Profiling in the Memory latency mode:
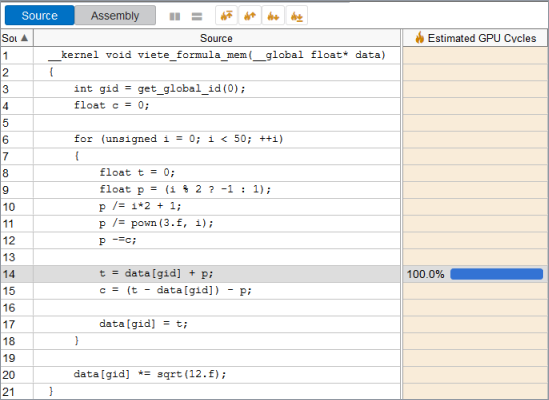
The Source view analysis shows that the compiler understands that each thread works only with its own element from the input buffer and generates the code that performs the read only once. The value from the input buffer is stored in the registry and reused in other operations, so the compiler does not generate additional reads.
Analyze XVE Stalls
Whenever your GPU is not fully employed, use available guidance for Xe Vector Engines (XVEs) to understand reasons for stalled or idle behavior in some of your GPU stacks.
First, run the GPU Compute/Media Hotspots analysis in Characterization mode. Select the Overview option in this mode.
Once the analysis completes, check the Summary tab of the viewpoint. The XVE Array Stalled/Idle table displays a list of those Xe Vector Engines (XVEs) that remained in the stalled (received computing tasks but did not execute them) or idle (never received computing tasks) states when the profiling happened. Both of these cases present areas for improvement and better use of available hardware.
For a GPU stack with high values of the XVE Array Stalled metric, your next step is to run the GPU Compute/Media Hotspots analysis in the Source Analysis mode.
In the Source Analysis mode, select the Stall Reasons option before you repeat the analysis.
When the analysis completes, see the Hottest GPU Computing Tasks table. Here, you can find a list of the busiest functions sorted in order by Total Time.

For computing tasks that caused an XVE stall, you can learn about the various reasons that contributed to the stall.
Click on a function and switch to the Graphics view to see a distribution of stall counts. Make sure to select the Computing Task/Function grouping in the Graphics view to locate the stalls for each computing task.

There may be several possible reasons for a stall in your Xe Vector Engine (XVE). The following table describes these reasons:
| Reason for XVE Stall | Explanation |
|---|---|
| Active | At least one instruction is dispatching into a pipeline. |
| Control | The percentage of stalls when the instruction was waiting for a Branch unit to become available. |
| Dist or Acc | The percentage of stalls when the instruction was waiting for a Distance or Architecture Register File (ARF) dependency to resolve. |
| Instruction Fetch | The percentage of stalls when the XVE was waiting for an instruction to be returned from the instruction cache. |
| Pipe | The percentage of stalls when the instruction won arbitration but could not be dispatched into a Floating-Point or Extended Math unit. This can occur due to a bank conflict with the General Registry File (GRF). |
| SBID | The percentage of stalls when the instruction was waiting for a Software Scoreboard dependency to resolve. |
| Send | The percentage of stalls when the instruction was waiting for a Send unit to become available. |
| Synchronization | The percentage of stalls when the instruction was waiting for a thread synchronization dependency to resolve. |
| Other | The percentage of stalls when other factors stalled the execution of the instruction. |
Examine Energy Consumption by your GPU
In Linux environments, when you run the GPU Compute/Media Hotspots analysis on an Intel® Iris® X e MAX graphics discrete GPU, you can see energy consumption information for the GPU device. To collect this information, make sure you check the Analyze power usage option when you configure the analysis.
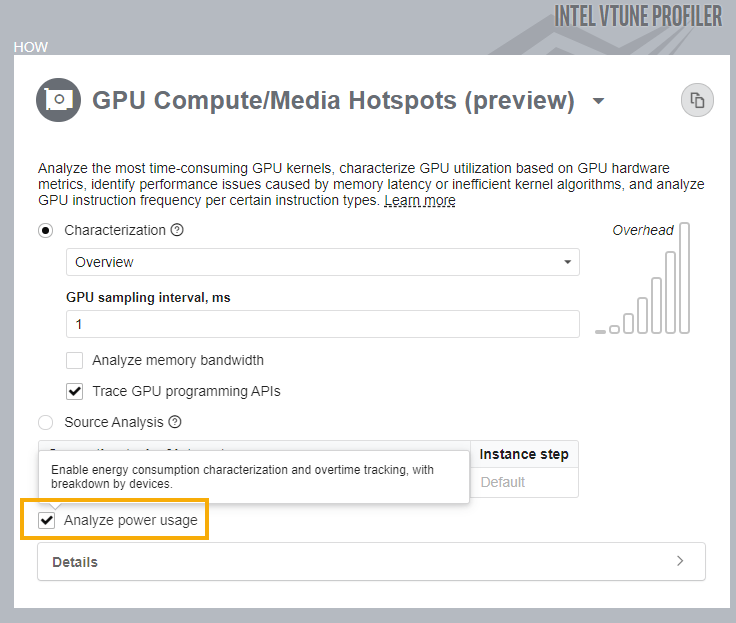
Once the analysis completes, see energy consumption data in these sections of your results.
In the Graphics window, observe the Energy Consumption column in the grid when grouped by Computing Task. Sort this column to identify the GPU kernels that consumed the most energy. You can also see this information mapped in the timeline.
When you locate individual GPU kernels that consume the most energy, for optimum power efficiency, start by tuning the top energy hotspot.
If your goal is to optimize GPU processing time, keep a check on energy consumption metrics per kernel to monitor the tradeoff between performance time and power use.
Move the Energy Consumption column next to Total Time to make this comparison easier.
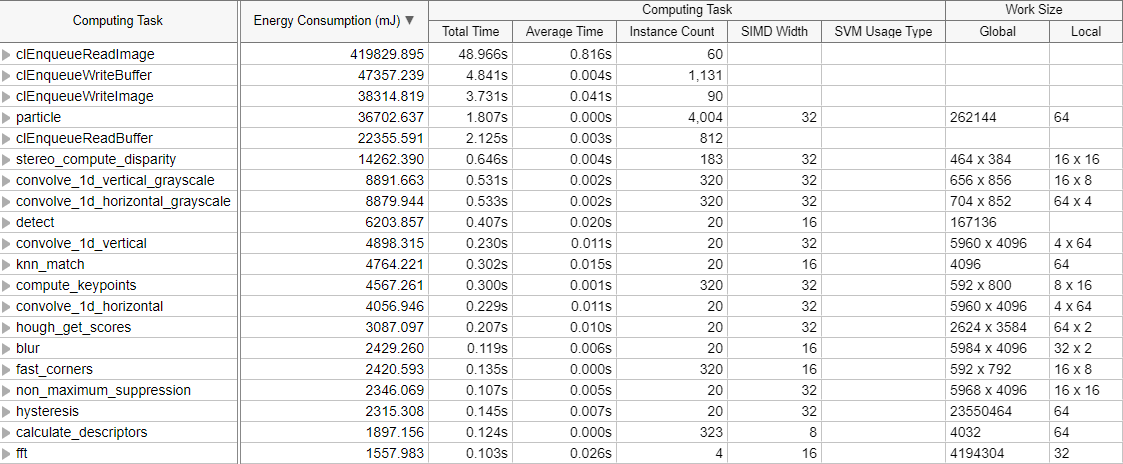
You may notice that the correlation between power use and processing time is not direct. The kernels that compute the fastest may not be the same kernels that consume the least amounts of energy. Check to see if larger values of power usage correspond to longer stalls/wait periods.