A newer version of this document is available. Customers should click here to go to the newest version.
Get Help
Use these documents and resources to better understand functionality inIntel® VTune™ Profiler:
All documentation for VTune Profiler is available online in the Intel Software Documentation Library on Intel Developer Zone (IDZ). You can also download an offline version of the VTune Profiler documentation.
Access Documentation
Access product documentation through one of these ways:
For the cross-platform standalone user interface of the VTune Profiler: Click the
 menu button and select Help > documentation_format or click the
  Help button on the product toolbar.
 Windows* only: For the VTune Profiler integrated into the Visual Studio user interface, select Intel VTune Profilerversion > documentation_format from the Help menu or click the product icon on the toolbar.
VTune Profiler is shipped as a standalone version and as part of Intel oneAPI Base Toolkit. Access to VTune Profiler documentation may vary depending on the product shipment.
You need an internet connection to access all VTune Profiler documentation formats listed in the menu.
Google* Chrome* is the recommended browser to view a downloaded copy of the VTune Profiler documentation. If you use Microsoft* Internet Explorer* or Microsoft Edge* browser, you may encounter these issues:
Internet Explorer 11: No help topics show up when you select them in the TOC pane.
Solution: Add http://localhost to the list of trusted sites in the Tools > Internet Options > Security tab. You can remove the site when you finish viewing the documentation.
Microsoft Edge: Help panes are truncated and a proper style sheet is not applied.
Solution: Click the Menu <…> and select Open with Internet Explorer.
Installation Guides
Installation Guides contain installation instructions for installing the product and post-installation configuration steps.
Get Started Guide
VTune Profiler provides a Get Started guide that includes a brief product introduction, provides a basic usage flow and links to additional resources, like Tutorials using a variety of tuning scenarios for sample applications. This guide automatically opens after product installation. You can also access this document through the Help menu/toolbar button or Get Stared link on the Welcome page.
VTune Profiler User Guide
VTune Profiler User Guide documents concepts, procedures, and reference information required to successfully work with the product. The User Guide is available from the Intel Software Documentation Library on the web and accessible via the Help menu or the  Help toolbar button.
Context-Sensitive Help
Access help topics on active GUI elements through context-sensitive help configured in VTune Profiler. These features are available on a product-specific basis:
Learn more | F1 button |
 Context Help button provide help for an active dialog box, property page, pane, or window.
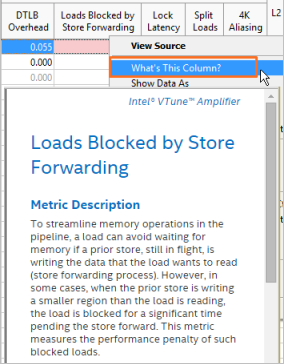
 What's This Column: In the grid, right-click a performance metric column and select the What's This Column entry from the context menu to open a help topic for this particular metric. You can also view a lightweight metric description in the pop-up window when hovering over the column name.

Help Tour
Use the Help Tour on the Welcome page to get started with Intel® VTune™ Profiler and understand its interface. The tour uses a sample project to guide you through a typical workflow.
Overlays
In some windows, an overlay outlines useful tips to manage analysis data and enhance your experience. Where available, click the  icon for a tour of useful features in the analysis window.

Tutorials and Cookbook
VTune Profiler provides 15-minute tutorials that show you how to use basic or advanced product features with a short sample. The tutorials provide an excellent foundation before you read the VTune Profiler help. For details, see the Tutorials and Samples topic.
For featured tuning and configuration scenarios, explore the Intel® VTune™ Profiler Performance Analysis Cookbook.
Command Line Interface Cheat Sheet
Use the Command Line Interface Cheat Sheet PDF for quick reference on VTune Profiler CLI.
Articles, Webinars, and Videos
Access a library of articles and video content that can help you complete specific tasks with VTune Profiler.
- Articles
- Webinars - Detailed video content that illustrate workflows and methodologies.
- How-to Videos - Short instructional videos to guide you with common tasks with VTune Profiler
Intel Processor Event Reference
VTune Profiler documentation includes Reference for Intel processor events. To access the Reference for a particular Intel processor/microarchitecture, select Intel Processor Event Reference option from the Help menu and choose the required microarchitecture/processor.
You can also find it useful to explore Tuning Guides for Intel microarchitecture created by Intel architects and available on the web.
Release Notes
VTune Profiler Release Notes provide the most up-to-date information about the product, including a product description, technical support, system requirements, and known limitations and issues.