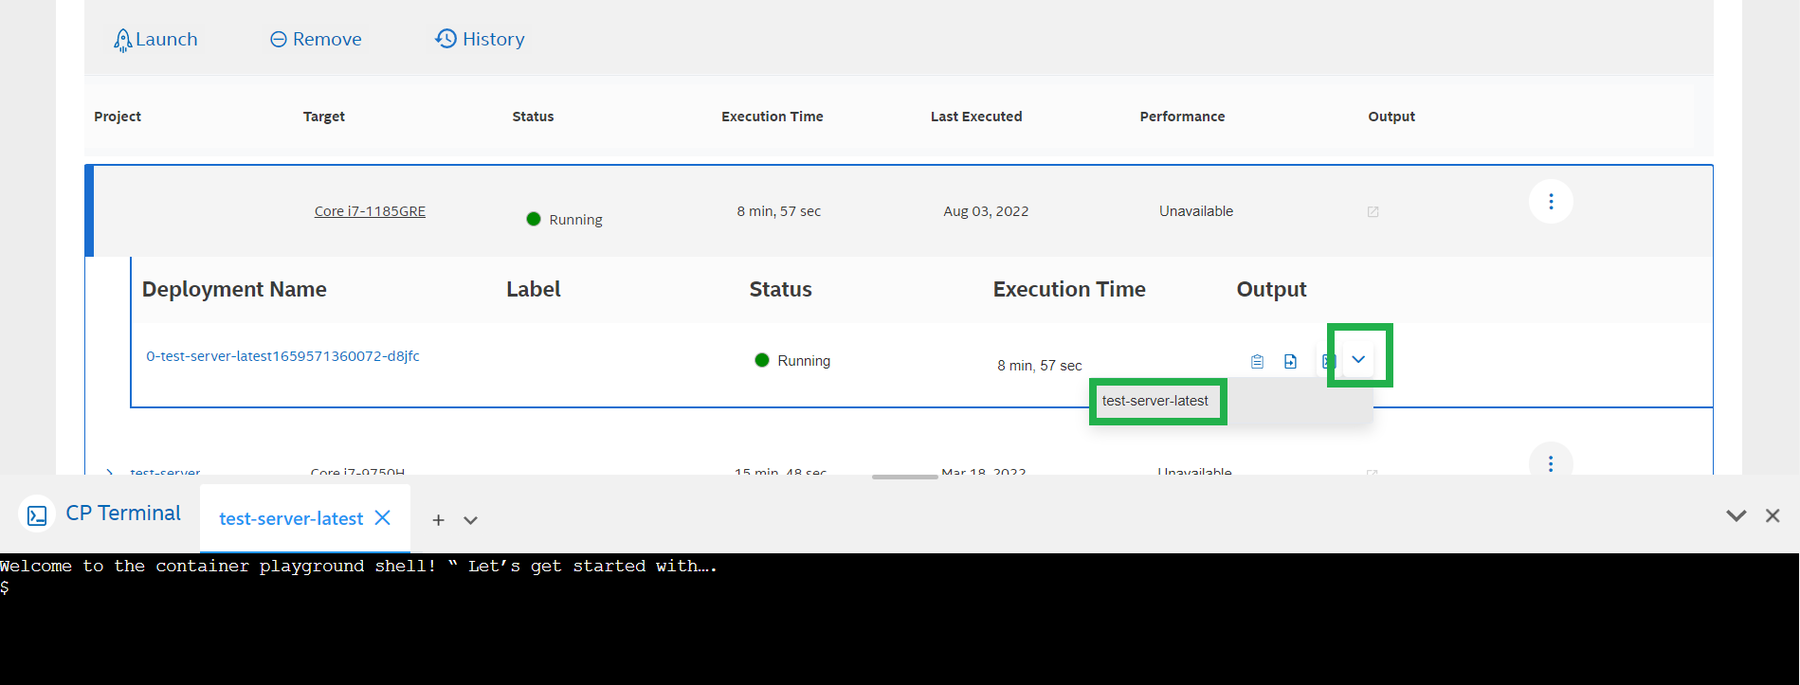
View status, output and performance
Depending on the configuration and behavior of your container application, you can analyze your workload in multiple ways. You can use this section as a reference to prepare your container as well.
Monitor Status
The status of your project can be monitored with Queued, Deploying, Failed or Error . Depending upon the expected behaviour of your container, the status can be in Running state for up to 30mins or Completed if the program completes execution.
Container Logs
From the Dashboard view of the Container Playground, expand your project run and click on the Log Output icon. Use the Refresh Stream button in the pop-up to refresh the latest console logs of your container application while in the Running or Completed state.

Performance Dashboard
Once your project reaches Completed status, expand your project and click on Performance Metrics to view detailed CPU, GPU, memory utilization and temperature metrics for the entire duration of your workload.

- The greyed out Performance metrics icon will be enabled within few minutes of completion, without any additional project configuration.
For projects launched with multiple containers on the same platform, the legend indicates multi_container_workload in resource sharing scenarios.
If you come across Telemetry Error or Telemetry Data expired message, please Request Support ( A product or service I already own or use > Search for a product or service by name > devcloud for the edge) .
You can also enable throughput (fps) and latency (ms) in the dashboard to quickly compare multiple runs on various Intel Platforms.

Your container must write out a FP16/performance.txt file in below format. You must also Configure imported containers with an Output Mount Point before launching.
Throughput: 104 FPS
Latency: 13457.780 ms
The Intel® Developer Cloud for the Edge portal recursively looks for the performance.txt file and FP16 directory in your Mount Point or Result Path directories.
Data in Filesystem
You must Configure imported containers with a Mount Point before launching to enable storing data into the filesystem for your container. From the Dashboard view of the Container Playground, expand your project and click on the FileSystem icon next to the Log Output to open the FileSystem view from the My Library tab.

Web Service URLs
If your containers expose web-services such as grafana dashboard that can be accessed in a browser, you can Expose Routes while configuring your imported containers.
Container Terminal Access
When the project is in Running state, you can gain access to the container terminal for easy debugging.
