Visible to Intel only — GUID: tuw1521840168934
Ixiasoft
2.1. Step 1: Getting Started
2.2. Step 2: Preparing the Base Revision
2.3. Step 3: Preparing the Implementation Revisions for Debug
2.4. Step 4: Tapping Signals in the Implementation Persona
2.5. Step 5: Configuring Data Acquisition
2.6. Step 6: Setting Trigger Conditions
2.7. Step 7: Generating Programming Files
2.8. Step 8: Programming the Board
2.9. Step 9: Performing Data Acquisition
Visible to Intel only — GUID: tuw1521840168934
Ixiasoft
1.1. PR Debug Considerations
Debugging a PR design requires planning. Before compiling, you must decide whether you want to tap signals in the static region, which PR region you want to debug, and which personas in the PR region you want to debug.
To ensure visibility, the debugging fabric must extend to all the regions that you want to tap. The Intel® Quartus® Prime software performs this extension with debug bridge components: the SLD JTAG Bridge Agent Intel® FPGA IP and the SLD JTAG Bridge Host Intel® FPGA IP.
To incorporate these components to the design, for each PR region in the design that you want to debug:
- Instantiate the SLD JTAG Bridge Agent in the static region.
- Instantiate the SLD JTAG Bridge Host in the PR region of the default persona.
- Instantiate the SLD JTAG Bridge Host on the implementation revisions that you want to debug.
Figure 1. Debug Fabric in PR Design with Signal Tap The figure shows in solid outline the entities that you instantiate manually, and in dashed outline the entities that the Compiler instantiates.
SLD JTAG Bridge Index
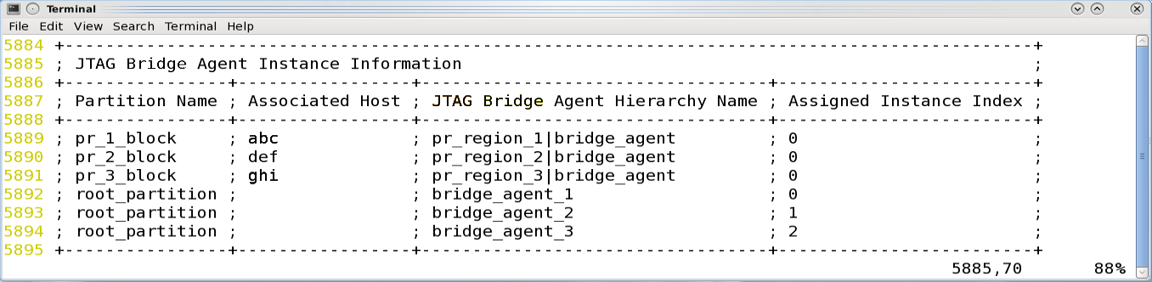
The index is an attribute of the SLD JTAG Bridge Agent that uniquely identifies bridge agents present in the design. You can find information regarding the bridge index in the synthesis report (<base revision>.syn.rpt), by looking under JTAG Bridge Agent Instance Information. The bridge index for the root partition is always None.
Figure 2. JTAG Bridge Agent Instance Information in Synthesis Report
Related Information