Intel® FPGA SDK for OpenCL™ Pro Edition: Best Practices Guide
ID
683521
Date
3/28/2022
Public
A newer version of this document is available. Customers should click here to go to the newest version.
1. Introduction to Intel® FPGA SDK for OpenCL™ Pro Edition Best Practices Guide
2. Reviewing Your Kernel's report.html File
3. OpenCL Kernel Design Concepts
4. OpenCL Kernel Design Best Practices
5. Profiling Your Kernel to Identify Performance Bottlenecks
6. Strategies for Improving Single Work-Item Kernel Performance
7. Strategies for Improving NDRange Kernel Data Processing Efficiency
8. Strategies for Improving Memory Access Efficiency
9. Strategies for Optimizing FPGA Area Usage
10. Strategies for Optimizing Intel® Stratix® 10 OpenCL Designs
11. Strategies for Improving Performance in Your Host Application
12. Intel® FPGA SDK for OpenCL™ Pro Edition Best Practices Guide Archives
A. Document Revision History for the Intel® FPGA SDK for OpenCL™ Pro Edition Best Practices Guide
2.1. High-Level Design Report Layout
2.2. Reviewing the Summary Report
2.3. Viewing Throughput Bottlenecks in the Design
2.4. Using Views
2.5. Analyzing Throughput
2.6. Reviewing Area Information
2.7. Optimizing an OpenCL Design Example Based on Information in the HTML Report
2.8. Accessing HLD FPGA Reports in JSON Format
4.1. Transferring Data Via Intel® FPGA SDK for OpenCL™ Channels or OpenCL Pipes
4.2. Unrolling Loops
4.3. Optimizing Floating-Point Operations
4.4. Allocating Aligned Memory
4.5. Aligning a Struct with or without Padding
4.6. Maintaining Similar Structures for Vector Type Elements
4.7. Avoiding Pointer Aliasing
4.8. Avoid Expensive Functions
4.9. Avoiding Work-Item ID-Dependent Backward Branching
5.1. Best Practices for Profiling Your Kernel
5.2. Instrumenting the Kernel Pipeline with Performance Counters (-profile)
5.3. Obtaining Profiling Data During Runtime
5.4. Reducing Area Resource Use While Profiling
5.5. Temporal Performance Collection
5.6. Performance Data Types
5.7. Interpreting the Profiling Information
5.8. Profiler Analyses of Example OpenCL Design Scenarios
5.9. Intel® FPGA Dynamic Profiler for OpenCL™ Limitations
8.1. General Guidelines on Optimizing Memory Accesses
8.2. Optimize Global Memory Accesses
8.3. Performing Kernel Computations Using Constant, Local or Private Memory
8.4. Improving Kernel Performance by Banking the Local Memory
8.5. Optimizing Accesses to Local Memory by Controlling the Memory Replication Factor
8.6. Minimizing the Memory Dependencies for Loop Pipelining
8.7. Static Memory Coalescing
2.4.1.2. Reviewing Global Memory Information
The global memory view of the System Viewer provides a list of all global memories in the design. The global memory view shows the following:
- Connectivity within the system showing data flow direction between global memory and kernels
- Memory throughput bottlenecks
- Status of the offline compiler flags, such as -num-reorder and -force-single-store-ring
- Global load-store unit (LSU) types
- Type of write/read interconnects
- Number of write rings
- Number and connectivity of read-router buses
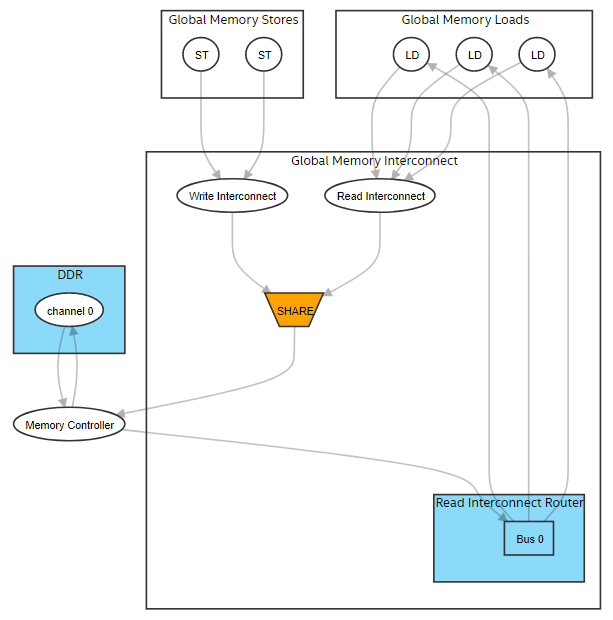
The following image is an example of the global memory view of the System Viewer:
Figure 13. Graphical Representation of the Global Memory in the System Viewer


In Graphical Representation of the Global Memory in the System Viewer:
- When you select stores or loads, you can view respective lines in the source code and details about the LSU type and LSU-level bandwidth.
- For the write interconnect block, you can view the interconnect style, number of writes to the global memory, status of the -force-single-store-ring compiler flag, and number of store rings.
- For the read interconnect block, you can view the interconnect style and number of reads from the global memory.
- For the read interconnect router block, you can view the status of the -num-reorder flag, total number of buses, and all connections between buses and load LSUs. Buses in this block provide read data from the memory to load LSUs.
- For the global memory (DDR in Graphical Representation of the Global Memory in the System Viewer), you can view the status of interleaving, interleaving size, number of channels, maximum bandwidth the BSP can deliver, and channel width.
- For the memory controller block, you can view the maximum bandwidth the BSP can deliver, sum of the load/store throughput, and read/write bandwidth. For additional information about how global memory bandwidth use is calculated, refer to Global Memory Bandwidth Use in this guide. It describes the formulas used in calculating the bandwidth.
- LSUs using USM pointers show up twice in both host and device global memory views as they can access both memories.