Visible to Intel only — GUID: GUID-226F2FAA-9FBE-44B2-9452-7274C120BB65
Visible to Intel only — GUID: GUID-226F2FAA-9FBE-44B2-9452-7274C120BB65
Multi-Stack GPU Architecture
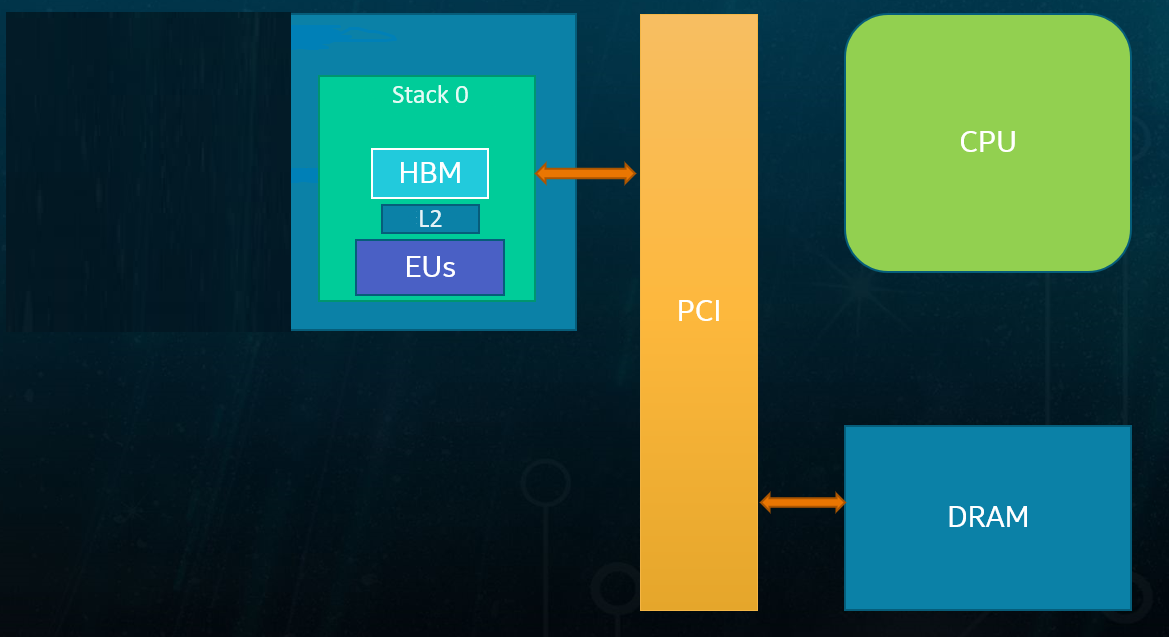
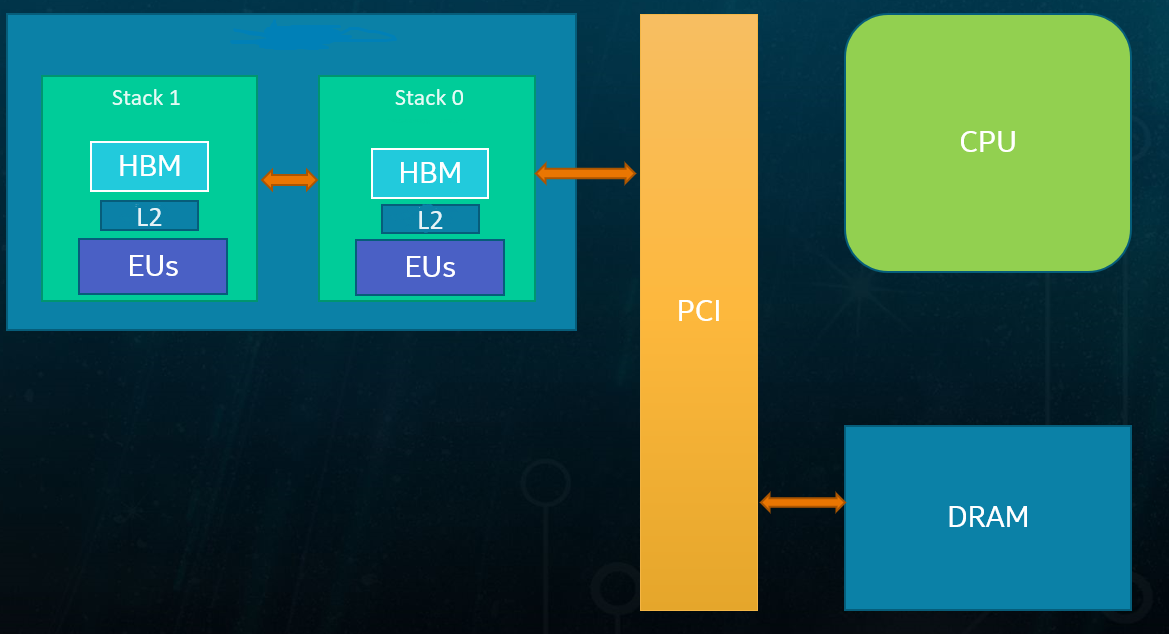
Intel® Data Center GPU Max Series use a multi-stack GPU architecture with 1 or 2 stacks.


The above figure illustrates 1-stack and 2-stack Intel® Data Center GPU Max Series products, each with its own dedicated resources:
- Vector Engines (VEs)
-
Computation units belong to the stack
- High Bandwidth Memory (HBM)
-
HBM directly connected to the stack
- Level 2 Cache (L2)
-
Level 2 cache belonging to the stack
For general applications, the most common mode is to use each stack as a device (see next section, Exposing the Device Hierarchy). Intel GPU driver, as well as SYCL and OpenMP parallel language runtimes work together to dispatch kernels to the stack(s) in the GPU.
Stacks are connected with fast interconnect that allows efficient communication between stacks. The following operations are possible:
- Any stack is capable of reading and writing to any HBM memory in the same GPU card.
-
For example, stack 0 may read the local HBM memory of stack 1. In this case, the interconnect between stack 0 and stack 1 is used for communication.
- Each stack is an independent entity
-
The stack can execute workloads on its own.
Because access to a stack’s local HBM does not involve inter-stack interconnect, it is more efficient than cross-stack HBM access, with lower latency and lower inter-stack bandwidth consumption. Advanced developers can take advantage of memory locality to achieve higher performance.
The default for each stack is to use a single Compute Command Streamer (CCS) that includes all the hardware computing resources on that stack. Most applications will work well in this mode.
It is also possible to statically partition each stack, via the environment variable ZEX_NUMBER_OF_CCS, into a 2-CCS mode or 4-CCS mode configuration, and treat each CCS as an entity to which kernels can be offloaded. For more information, refer to Advanced Topics.
GPU Memory System
The memory for a general-purpose engine is partitioned into host-side memory and device-side memory as shown in the following figure, using Unified Shared Memory (USM) to move objects between the two sides. Each address hashes to a unique bank. Approximate uniform distribution for sequential, strided, and random addresses.
Full bandwidth when same number of banks as Xe-cores (reduced by queuing congestion, hot-spotting, bank congestion).
TLB misses on virtual address translation increase memory latency. May trigger more memory accesses and cache evictions.
High miss rate on GPU cache may decrease GPU Memory controller efficiency when presented with highly distributed accesses.
Compression unit compresses adjacent cache lines. Also supports read/write of fast-clear surfaces. Improves bandwidth but also adds latency.

GPU Memory accesses measured at VE:
Sustained fabric bandwidth ~90% of peak
GPU cache hit ~150 cycles, cache miss ~300 cycles. TLB miss adds 50-150 cycles
GPU cache line read after write to same cache line adds ~30 cycles
Stacks accessing device memory on a different stack utilize a new GAM-to-GAM High bandwidth interface (“GT Link”) between stacks. The bandwidth of this interface closely matches the memory bandwidth that can be handled by the device memory sub-system of any single stack.
Loads/Stores/Atomics in VE Threads
VE threads make memory accesses by sending messages to a data-port, the load instruction sends address and receives data, The store instructions send address and data. All VE in Xe-core share one Memory Load/Store data-port as shown in the figure below.
Inside Xe-core: ~128-256 Bytes per cycle
Outside Xe-core: ~64 Bytes per cycle
Read bandwidth sometimes higher than write bandwidth

A new memory access can be started every cycle, typical 32b SIMD16 SEND operations complete in 6 cycles plus their memory latency (4-element vectors complete in 12 cycles plus memory latency), and Independent addresses are merged to minimize memory bandwidth. Keep it mind on memory latencies:
Access type |
Latency |
|---|---|
Shared local memory |
~30 cycles |
Xe-core data cache hit |
~50 cycles |
GPU cache hit |
~150 - ~200 cycles |
GPU cache miss |
~300 - ~500 cycles |
All Loads/Stores are relaxed ordering (ISO C11 memory model; Read and Write) are in-order for the same address from the same thread. Different addresses in the same thread may complete out-of-order, Read/Write ordering is not maintained between threads nor VEs nor Xe-cores, so code needs to use atomic and/or fence operations to guarantee additional ordering.
An atomic operation may involve both reading from and then writing to a memory location. Atomic operations apply only to either unordered access views or thread-group shared memory. It is guaranteed that when a thread issues an atomic operation on a memory address, no write to the same address from outside the current atomic operation by any thread can occur between the atomic read and write.
If multiple atomic operations from different threads target the same address, the operations are serialized in an undefined order. This serialization occurs due to L2 serialization rules to the same address. Atomic operations do not imply a memory or thread fence. If the program author/compiler does not make appropriate use of fences, it is not guaranteed that all threads see the result of any given memory operation at the same time, or in any particular order with respect to updates to other memory addresses. However, atomic operations are always stated on a global level (except on shared local memory), and when the atomic operation is complete the final result is always visible to all thread groups. Each generation since Gen7 has increased the capability and performance of atomic operations.
The following SYCL code example performs 1024 same address atomic operations per work item. Each work item use a different (unique) address, compiler generates SIMD32 kernel for each VE thread, which will perform 2 SIMD16 atomic operations on 2 cache-lines, and compiler unrolls loop ~8 times to reduce register dependency stalls as well.
#include <CL/sycl.hpp>
#include <chrono>
#include <iostream>
#include <string>
#include <unistd.h>
#include <vector>

#ifndef SCALE
#define SCALE  1
#endif

#define N        1024*SCALE
#define SG_SIZE  32

// Number of repetitions
constexpr int repetitions = 16;
constexpr int warm_up_token = -1;

static auto exception_handler = [](sycl::exception_list eList) {
  for (std::exception_ptr const &e : eList) {
    try {
      std::rethrow_exception(e);
    } catch (std::exception const &e) {
      std::cout << "Failure" << std::endl;
      std::terminate();
    }
  }
};

class Timer {
public:
  Timer() : start_(std::chrono::steady_clock::now()) {}

  double Elapsed() {
    auto now = std::chrono::steady_clock::now();
    return std::chrono::duration_cast<Duration>(now - start_).count();
  }

private:
  using Duration = std::chrono::duration<double>;
  std::chrono::steady_clock::time_point start_;
};

#ifdef FLUSH_CACHE
void flush_cache(sycl::queue &q, sycl::buffer<int> &flush_buf) {
  auto flush_size = flush_buf.get_size()/sizeof(int);
  auto ev = q.submit([&](auto &h) {
    sycl::accessor flush_acc(flush_buf, h, sycl::write_only, sycl::noinit);
    h.parallel_for(flush_size, [=](auto index) { flush_acc[index] = 1; });
  });
  ev.wait_and_throw();
}
#endif

void atomicLatencyTest(sycl::queue &q, sycl::buffer<int> inbuf,
                       sycl::buffer<int> flush_buf, int &res, int iter) {
  sycl::buffer<int> sum_buf(&res, 1);

  double elapsed = 0;

  for (int k = warm_up_token; k < iter; k++) {
#ifdef FLUSH_CACHE
    flush_cache(q, flush_buf);
#endif

    Timer timer;

    q.submit([&](auto &h) {
      sycl::accessor buf_acc(inbuf, h, sycl::write_only, sycl::no_init);

      h.parallel_for(sycl::nd_range<1>(sycl::range<>{N}, sycl::range<>{SG_SIZE}), [=](sycl::nd_item<1> item)
                                                    [[intel::reqd_sub_group_size(SG_SIZE)]] {
        int i = item.get_global_id(0);
        for (int ii = 0; ii < 1024; ++ii) {
	  auto v =
          #ifdef ATOMIC_RELAXED
             sycl::atomic_ref<int, sycl::memory_order::relaxed,
                               sycl::memory_scope::device,
                               sycl::access::address_space::global_space>(buf_acc[i]);
          #else
             sycl::atomic_ref<int, sycl::memory_order::acq_rel,
                               sycl::memory_scope::device,
                               sycl::access::address_space::global_space>(buf_acc[i]);
          #endif
          v.fetch_add(1);
        }
      });
    });
    q.wait();
    elapsed += (iter == warm_up_token) ? 0 : timer.Elapsed();
  }
  std::cout << "SUCCESS: Time atomicLatency = " << elapsed << "s" << std::endl;
}

int main(int argc, char *argv[]) {
  sycl::queue q{sycl::gpu_selector_v, exception_handler};
  std::cout << q.get_device().get_info<sycl::info::device::name>() << std::endl;

  std::vector<int> data(N);
  std::vector<int> extra(N);

  for (size_t i = 0; i < N ; ++i) {
    data[i]  = 1;
    extra[i] = 1;
  }
  int res=0;

  const sycl::property_list props = {sycl::property::buffer::use_host_ptr()};
  sycl::buffer<int> buf(data.data(), data.size(), props);
  sycl::buffer<int> flush_buf(extra.data(), extra.size(), props);
  atomicLatencyTest(q, buf, flush_buf, res, 16);
}
In real workloads with atomics, users need to understand memory access behaviors and data set sizes when selecting an atomic operation to achieve optimal bandwidth.