Visible to Intel only — GUID: GUID-88CB3F8E-0E84-43F4-BC5E-3001E52A0397
Visible to Intel only — GUID: GUID-88CB3F8E-0E84-43F4-BC5E-3001E52A0397
Running MPI Applications on GPUs
This section covers the following GPU-specific details of Intel® MPI Library:
Topology Detection
Execution Models
GPU Pinning
Multi-Stack, Multi-GPU and Multi-Node Support
GPU Benchmarks in Intel® MPI Benchmarks
Profiling MPI Applications on GPUs
Recommendations for better performance
Topology Detection
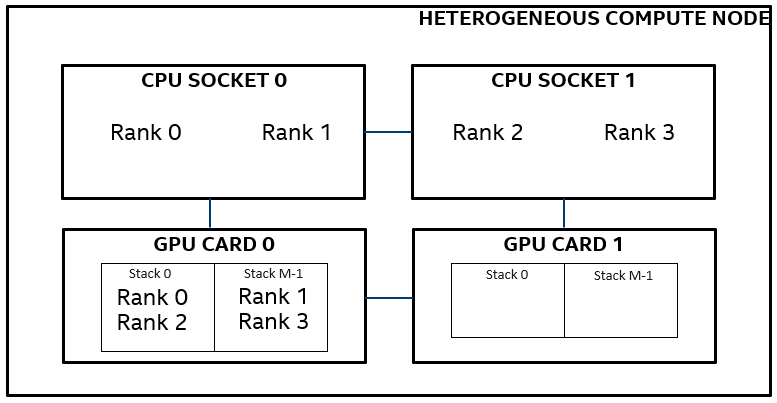
The figure below illustrates a typical GPU compute node, with two CPU sockets. Each CPU socket has N cores and is connected to a single GPU card with M stacks, making a total of 2N cores and 2M stacks per node.
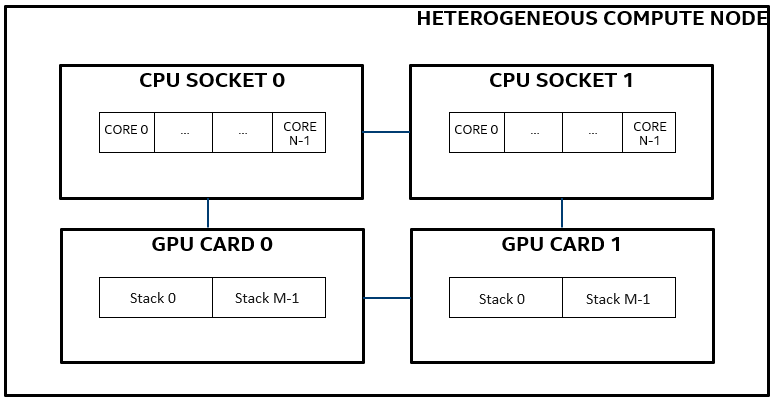
Variations of the above topology are possible. Use the cpuinfo -g command to see details:
$ cpuinfo -g
Intel(R) processor family information utility, Version 2021.11 Build
20231005 (id: 74c4a23)

Copyright (C) 2005-2021 Intel Corporation. All rights reserved.

===== Processor composition =====
Processor name : Intel(R) Xeon(R) Gold 8480+
Packages(sockets) : 2
Cores : 112
Processors(CPUs) : 224
Cores per package : 56
Threads per core : 2
In this example, we have a dual socket node with 56 cores per socket, making a total of 112 physical cores per node. To further understand the GPU topology, one may use Intel® MPI Library’s debug output. To activate this, run your application with two additional environment variables, i.e. I_MPI_DEBUG = 3 or above and I_MPI_OFFLOAD = 1.
[0] MPI startup(): ===== GPU topology on host1 =====
[0] MPI startup(): NUMA Id GPU Id Stacks Ranks on this NUMA
[0] MPI startup(): 0       0      (0,1)  0,1
[0] MPI startup(): 1       1      (2,3)  2,3
The above truncated output shows that there are 2 GPUs and 2 stacks per GPU. Stacks 0 and 1 belong to GPU 0, while stacks 2 and 3 belong to GPU 1.
Execution Models
Developers may use the Intel® MPI Library in a GPU environment in many ways. Some of the most common scenarios are described below.
Naïve
In this model, the MPI functions are executed on the host (CPU for all practical purposes) alone and the underlying MPI library is not required to be device (here, GPU) aware. As shown in the figure below, developers are responsible for taking care of data movements between the host and device (use of to: and tofrom:). In this model, applications making frequent MPI communications might suffer from excessive data movements between the host and device. However, this approach might still be useful for very small message sizes.
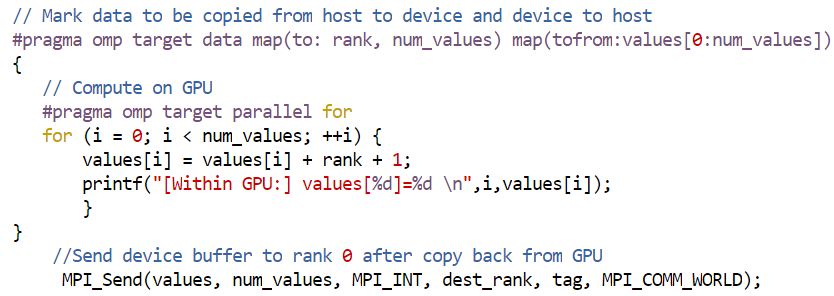
Please note that MPI_Send appears outside the scope of both offload pragmas in the previous figure. Both SYCL and OpenMP offload constructs may be used for the required data movements between the host and device.
GPU Aware MPI
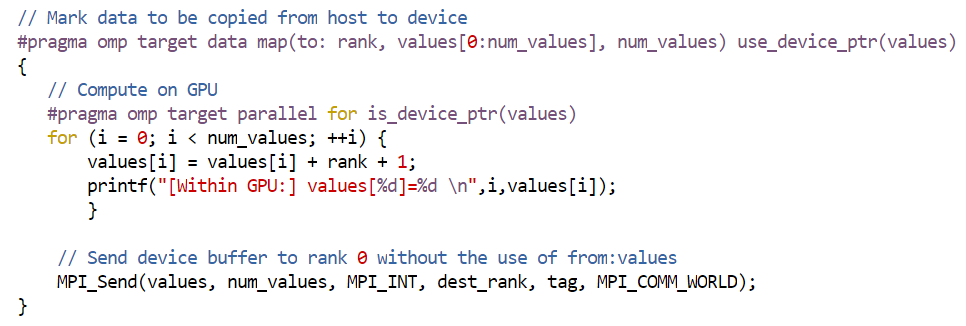
In this model, the underlying MPI library is aware of GPU buffers, hence developers are relieved from the task of explicit data movement between the host and device. However, to pass a pointer of an offload-able memory region to MPI, developers may need to use specific compiler directives or get it from corresponding acceleration runtime API. Apart from moving the data as required, The Intel® MPI Library also optimizes data movement between the host and device to hide the data transfer costs as much as possible. The MPI calls still run on the host. A new environment variable called I_MPI_OFFLOAD was introduced for GPU buffer support. As shown in the following figure, MPI_Send appears outside the scope of omp target parallel for pragma but inside the scope of the target pragma responsible for data movement. Also note that the pointer values is marked using the use_device_ptr and is_device_ptr keywords to enable values pointer to be correctly processed by the Intel® MPI Library. GPU aware features of Intel® MPI Library can be used from within both SYCL and OpenMP-offload based applications.
Build command
$ mpiicx -qopenmp -fopenmp-targets=spir64 test.c -o test
where, -qopenmp enables a middle-end that supports the transformation of OpenMP in LLVM; and -fopenmp-targets=spir64 enables the compiler to generate a x86 + SPIR64 fat binary for the GPU device binary generation.
Run command
$ export I_MPI_OFFLOAD=1
$ mpiexec.hydra -n 2 ./test
I_MPI_OFFLOAD controls handling of device buffers in MPI functions. A value of 1 enables handling of device buffers under the assumption that libze_loader.so is already loaded. If the library is not already loaded (which is unexpected), then GPU buffer support will not be enabled. To enforce Intel® MPI Library to load libze_loader.soI_MPI_OFFLOAD should be set to 2.
Kernel Based Collectives
Unlike the GPU aware MPI model, this model supports execution of MPI scale-up kernels by the device directly. This approach helps eliminate data transfers between the host and device that were made owing to the execution of MPI calls on the host. MPI-like implementations like Intel® oneAPI Collective Communications Library (Intel® oneCCL) already support such functionalities for collective calls.
GPU Pinning
For a heterogeneous (CPU + GPU) MPI application, apart from allocating CPU cores to MPI ranks, it is also necessary to allocate available GPU resources to ranks. In the context of the Intel® MPI Library, by default the base unit of work on Intel’s discrete GPU is assumed to be a stack. Many environment variables have been introduced to achieve user desired pinning schemes. By default the Intel® MPI Library enforces a balanced pinning scheme, i.e., if the number of ranks per node are equal to the number of stacks, then 1 rank is assigned per stack. In case of oversubscription, a round robin scheme is used for the best possible balanced distribution. The Intel® MPI Library needs GPU topology awareness to enforce GPU pinning and this is achieved with the help of the Intel® oneAPI Level Zero. The following environment variable enables the use of Level Zero for topology detection,
$ export I_MPI_OFFLOAD_TOPOLIB=level_zero
Since Intel® MPI Library 2021 U6, setting I_MPI_OFFLOAD > 0 automatically sets I_MPI_OFFLOAD_TOPOLIB to level_zero. Further, in scenarios where GPU pinning needs to be disabled completely, the I_MPI_OFFLOAD_PIN environment variable is available to switch this support as needed.
At debug level 3 (i.e. I_MPI_DEBUG=3), Intel® MPI Library also prints the GPU pinning scheme (in addition to GPU topology) used at runtime, for the first host only. For topology and debug information from all hosts/nodes, use a debug level of 120 or above.
$ export I_MPI_DEBUG=3
Following is a sample debug output from an application running with 4 ranks on a node with four stacks:
[0] MPI startup(): ===== GPU topology on host1 =====
[0] MPI startup(): NUMA Id GPU Id Stacks Ranks on this NUMA
[0] MPI startup(): 0       0      (0,1)  0,1
[0] MPI startup(): 1       1      (2,3)  2,3

[0] MPI startup(): ===== GPU pinning on host1 =====
[0] MPI startup(): Rank Pin stack
[0] MPI startup(): 0      {0}
[0] MPI startup(): 1      {1}
[0] MPI startup(): 2      {2}
[0] MPI startup(): 3      {3}
The information under “GPU topology on host1” section should not be treated as GPU pinning information (the reason becomes more evident in the example below, where MPI ranks are pinned to GPU 0 only). Rather this section presents how the ranks are placed on NUMA nodes. For a node with just 1 NUMA domain per socket, NUMA IDs can be treated as CPU sockets. Under this assumption, one can interpret the GPU topology as follows:
GPU 0 is connected to CPU socket 0.
GPU 0 contains stacks 0 and 1.
Ranks 0 and 1 are placed on CPU socket 0.
Similarly,
GPU 1 is connected to CPU socket 1.
GPU 1 contains stacks 2 and 3.
Ranks 2 and 3 are placed on CPU socket 1.
The information under “GPU Pinning on host1” clarifies the rank to GPU stack pinning. Here, each rank is pinned to a unique stack. The same is also presented in the following figure.
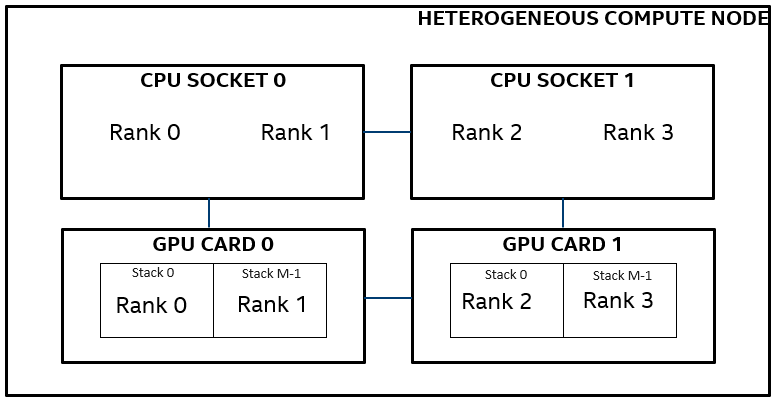
For more clarity, let’s consider another example. For the node depicted in the figure above, let’s assume that one would like to restrict execution to GPU 0 alone. This can be achieved using the following environment variable:
$ export I_MPI_OFFLOAD_DEVICES=0
As shown in the debug level 3 output (below), ranks 0, 1 and ranks 2, 3 reside on CPU sockets 0 and 1 respectively. However, since I_MPI_OFFLOAD_DEVICES was set to 0, all the ranks were pinned in a round robin manner to stacks of GPU 0 only. Please refer to above figure for a pictorial representation of the same.
[0] MPI startup(): ===== GPU topology on host1 =====
[0] MPI startup(): NUMA Id GPU Id Stacks Ranks on this NUMA
[0] MPI startup(): 0       0      (0,1)  0,1
[0] MPI startup(): 1       1      (2,3)  2,3
[0] MPI startup(): ===== GPU pinning on host1 =====
[0] MPI startup(): Rank Pin stack
[0] MPI startup(): 0      {0}
[0] MPI startup(): 1      {1}
[0] MPI startup(): 2      {0}
[0] MPI startup(): 3      {1}
Like the I_MPI_PIN_PROCESSOR_LIST environment variable available for defining a custom pinning scheme on CPU cores, a similar variable I_MPI_OFFLOAD_DEVICE_LIST is also available for GPU pinning. For more fine-grained pinning control, more variables like I_MPI_OFFLOAD_CELL, I_MPI_OFFLOAD_DOMAIN_SIZE, I_MPI_OFFLOAD_DOMAIN, etc. are available. Please refer to GPU Pinning for more details.
Multi-Stack, Multi-GPU and Multi-Node support
Modern heterogeneous (CPU + GPU) clusters present various GPU-specific scaling possibilities:
Stack scaling: scaling across stacks within the same GPU card (intra-GPU, inter-stack).
Scale-up: Scaling across multiple GPU cards connected to the same node (intra-node, inter-GPU).
Scale-out: Scaling across GPU cards connected to different nodes (inter-GPU, inter-node).
All of the above scenarios are transparently handled by the Intel® MPI Library and application developers are not required to make additional source changes for this purpose. Sample command lines for each scenario are presented below.
Baseline: All ranks run on stack 0
$ I_MPI_OFFLOAD_DEVICE_LIST=0 I_MPI_DEBUG=3 I_MPI_OFFLOAD=1
  mpiexec.hydra -n 2 ./mpi-binary
[0] MPI startup(): ===== GPU topology on host1 =====
[0] MPI startup(): NUMA Id GPU Id Stacks Ranks on this NUMA
[0] MPI startup(): 0 0 (0,1) 0
[0] MPI startup(): 1 1 (2,3) 1
[0] MPI startup(): ===== GPU pinning on host1 =====
[0] MPI startup(): Rank Pin stack
[0] MPI startup(): 0 {0}
[0] MPI startup(): 1 {0}
Stack scaling: 1 rank per stack on GPU 0
$ I_MPI_OFFLOAD_DEVICE_LIST=0,1 I_MPI_DEBUG=3
  I_MPI_OFFLOAD=1 mpiexec.hydra -n 2 ./mpi-binary
[0] MPI startup(): ===== GPU topology on host1 =====
[0] MPI startup(): NUMA Id GPU Id Stacks Ranks on this NUMA
[0] MPI startup(): 0 0 (0,1) 0
[0] MPI startup(): 1 1 (2,3) 1
[0] MPI startup(): ===== GPU pinning on host1 =====
[0] MPI startup(): Rank Pin stack
[0] MPI startup(): 0 {0}
[0] MPI startup(): 1 {1}
Scale-up: 1 rank per stack on GPU 0 and GPU 1
$ I_MPI_DEBUG=3 I_MPI_OFFLOAD=1
  mpiexec.hydra -n 4 ./mpi-binary
[0] MPI startup(): ===== GPU topology on host1 =====
[0] MPI startup(): NUMA Id GPU Id Stacks Ranks on this NUMA
[0] MPI startup(): 0 0 (0,1) 0,1
[0] MPI startup(): 1 1 (2,3) 2,3
[0] MPI startup(): ===== GPU pinning on host1 =====
[0] MPI startup(): Rank Pin stack
[0] MPI startup(): 0 {0}
[0] MPI startup(): 1 {1}
[0] MPI startup(): 2 {2}
[0] MPI startup(): 3 {3}
Scale-out: 1 rank per stack on GPUs 0, 1 of host1, GPUs 2, 3 of host2
$ I_MPI_DEBUG=3 I_MPI_OFFLOAD=1
  mpiexec.hydra -n 8 -ppn 4 -hosts host1,host2 ./mpi-binary
[0] MPI startup(): ===== GPU topology on host1 =====
[0] MPI startup(): NUMA Id GPU Id Stacks Ranks on this NUMA
[0] MPI startup(): 0 0 (0,1) 0,1
[0] MPI startup(): 1 1 (2,3) 2,3
[0] MPI startup(): ===== GPU pinning on host1 =====
[0] MPI startup(): Rank Pin stack
[0] MPI startup(): 0 {0}
[0] MPI startup(): 1 {1}
[0] MPI startup(): 2 {2}
[0] MPI startup(): 3 {3}
Similar pinning occurred on host2 as well (not shown here).
Considerations in FLAT mode
As described in the earlier sections on device hierarchy, the current GPU drivers offer FLAT mode as default. Using the ZE_FLAT_DEVICE_HIERARCHY environment variable it is possible to toggle between FLAT and COMPOSITE modes. In the FLAT mode, the node topology presented by Intel® MPI Library is not in alignment with other tools like sycl-ls or clinfo. This is not a bug but simply a design choice within Intel® MPI Library which selects GPU stack as the base unit of compute and always sees the true node topology, independent of the selected modes. This results in uniform distribution of ranks across available stacks, which maximizes overall system utilization.
Following is an example from a system with 4 Intel(R) Data Center GPU Max 1550 GPUs in FLAT mode, where sycl-ls enumerates 8 GPU devices, while Intel® MPI Library enumerates 4 GPU devices.
$ sycl-ls | grep GPU
[ext_oneapi_level_zero:gpu:0] Intel(R) Level-Zero, Intel(R) Data Center GPU Max 1550 1.3 [1.3.27191]
[ext_oneapi_level_zero:gpu:1] Intel(R) Level-Zero, Intel(R) Data Center GPU Max 1550 1.3 [1.3.27191]
[ext_oneapi_level_zero:gpu:2] Intel(R) Level-Zero, Intel(R) Data Center GPU Max 1550 1.3 [1.3.27191]
[ext_oneapi_level_zero:gpu:3] Intel(R) Level-Zero, Intel(R) Data Center GPU Max 1550 1.3 [1.3.27191]
[ext_oneapi_level_zero:gpu:4] Intel(R) Level-Zero, Intel(R) Data Center GPU Max 1550 1.3 [1.3.27191]
[ext_oneapi_level_zero:gpu:5] Intel(R) Level-Zero, Intel(R) Data Center GPU Max 1550 1.3 [1.3.27191]
[ext_oneapi_level_zero:gpu:6] Intel(R) Level-Zero, Intel(R) Data Center GPU Max 1550 1.3 [1.3.27191]
[ext_oneapi_level_zero:gpu:7] Intel(R) Level-Zero, Intel(R) Data Center GPU Max 1550 1.3 [1.3.27191]

$ I_MPI_DEBUG=3 I_MPI_OFFLOAD=1 mpirun -n 8 IMB-MPI1-GPU
[0] MPI startup(): ===== GPU topology on host1 =====
[0] MPI startup(): NUMA nodes : 2
[0] MPI startup(): GPUs       : 4
[0] MPI startup(): Tiles      : 8
[0] MPI startup(): NUMA Id      GPU Id         Tiles                          Ranks on this NUMA
[0] MPI startup(): 0            0,1            (0,1)(2,3)                     0,1,2,3
[0] MPI startup(): 1            2,3            (4,5)(6,7)                     4,5,6,7
In FLAT mode, sycl-ls enumerates 8 GPUs, i.e. each stack as a separate device (gpu:0 to gpu:7), while Intel® MPI Library shows 4 GPUs or 8 Stacks (Tiles). In COMPOSITE mode, there is no discrepancy between the outputs from Intel® MPI Library and sycl-ls or clinfo.
Please also note that the behavior of Intel® MPI Library, with regards to topology detection, pinning and performance does not change in FLAT and COMPOSITE modes.
A note on environment variables
In the workflow we have used so far, multiple components like Level Zero backend, compiler runtime, Intel® MPI Library runtime, etc. are in action at the same time. Each component provides a number of environment variables (knobs) to control the runtime environment based on user needs. Sometimes it is possible that conflicting knob settings from different components get made. To deal with such situations, certain rules are set in place, which ensures that one will have precedence over the other. A common scenario that one may come across, is using conflicting affinity knobs from Level Zero backend (for e.g. ZE_AFFINITY_MASK) and Intel® MPI Library (for e.g. I_MPI_OFFLOAD_CELL_LIST). In such a scenario, the Level Zero knobs will have a greater priority over Intel® MPI Library knobs. It is also possible to have scenarios where conflicting environment variables are hard to resolve, and a runtime error gets generated in such cases. It is therefore a good practice to consult to the product documentations to better understand the environment variables being used. Also, not all environment variables are a mandate, but rather a request to the runtimes involved, and it is a good practice to generate and analyze the debug outputs to ensure that the requested settings were obeyed.
GPU Benchmarks in Intel® MPI Benchmarks
The Intel® MPI Benchmarks perform a set of measurements for point-to-point and collective communication operations for a range of message sizes. The generated benchmark data helps assess the performance characteristics of a cluster and efficiency of the MPI implementation. Traditionally, IMB benchmarks ran on CPU only, GPU support was recently introduced. A pre-built binary called IMB-MPI1-GPU is shipped along with the Intel® MPI Library package and can be found in $I_MPI_ROOT/bin folder on a Linux machine. This binary can run in the GPU aware MPI model described earlier.
The following is an example command line for running IMB-MPI1-GPU for the default 0 - 4 MB message size range with 200 iterations per message size on a single node with 2 GPU cards. In this case, just the MPI_Allreduce function was executed. Many other MPI functions are also supported.
$ I_MPI_DEBUG=3 I_MPI_OFFLOAD=1
  mpiexec.hydra -n 4 -ppn 4
  IMB-MPI1-GPU allreduce -mem_alloc_type device -npmin 4 -iter 200
  -iter_policy off
The -mem_alloc_type flag controls where the MPI buffers reside. Since Intel® MPI Library 2021.4, the default value for -mem_alloc_type is device.
-npmin 4 restricts the minimum number of MPI ranks for IMB to 4 (if not, the target number of MPI ranks as specified by -n is reached in an incremental manner).
-iter 200 requests the number of iterations per message size to 200.
-iter_policy off switches off the auto reduction of iterations for large message sizes. In other words, -iter_policy off ensure that -iter 200 request is obeyed for all message sizes.
Line Saturation Test
In this sub-section we demonstrate Intel® MPI Library’s ability to saturate the interconnect bandwidth when GPU buffers are employed. Tests were run on two nodes, each with a dual socket Intel® Xeon® Platinum 8480+ processor and 2 Intel® Data Center GPU Max 1550 (Code name: Ponte Vecchio). The nodes were connected using Mellanox Quantum HDR interconnect which is rated at 200 Gb/s or 25 GB/s. A total of 2 MPI ranks were launched, i.e. 1 rank per node and the PingPong test was selected from the IMB-MPI1-GPU binary as shown in the following command:
$ I_MPI_DEBUG=3 I_MPI_OFFLOAD=1 mpiexec.hydra -n 2 -ppn 1
  -hosts host1,host2 IMB-MPI1-GPU pingpong -iter 100 -iter_policy off
  -msglog 0:28
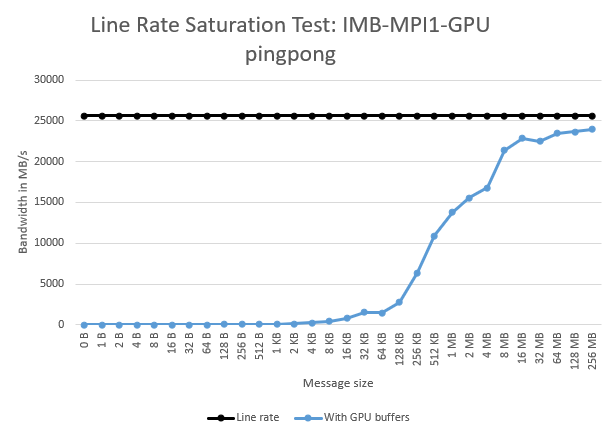
Intel® MPI Library 2021.8 was used for this line saturation test. Peak bandwidth of 23,948.98 MB/s was achieved which corresponds to a line rate efficiency of 93.6%.
Profiling MPI Applications on GPUs
Tools like Intel® VTune™ Profiler, Intel® Advisor, Intel® Inspector, etc. have been enhanced to work on Intel GPUs. As was the case with CPU profiling, these tools continue to be available for MPI applications in the context of GPUs. Some of the capabilities shall be presented here in the context of MPI applications.
The IMB-MPI1-GPU benchmark of the previous section will be considered here. One way to confirm if the MPI buffers were really allocated on the GPU memory is to check for PCIe traffic, which is bound to increase (versus the -mem_alloc_type CPU case) since the GPUs are connected to the CPU via PCIe. Intel® VTune™ Profiler’s Input and Output Analysis captures and displays several PCIe metrics.
Several modes of working with Intel® VTune™ Profiler on remote machines are available. Here the profiling data was collected from the command line interface of a remote machine. The result folder was then moved to a local machine for viewing on a local GUI. The following command lines were executed on the remote machine which hosted the GPU node.
Buffer allocation on CPU
$ I_MPI_OFFLOAD=1 mpiexec.hydra
  -n 4 -ppn 4 -f hostfile -gtool "vtune -collect io -r ./vtune_data1:0"
  IMB-MPI1-GPU allreduce -npmin 4 -iter 200 -iter_policy off
  -mem_alloc_type CPU
Buffer allocation on GPU
$ I_MPI_OFFLOAD=1 mpiexec.hydra
  -n 4 -ppn 4 -f hostfile -gtool "vtune -collect io -r
  ./vtune_data2:0" IMB-MPI1-GPU allreduce -npmin 4 -iter 200
  -iter_policy off
Here the -gtool flag was used to selectively launch VTune on rank 0 only (as specified by the last two arguments to -gtool, i.e. :0).
As can be observed from the Bandwidth Utilization Histogram in the Summary tab of the Input and Output Analysis (following figures), PCIe traffic is significantly higher in the case where the MPI buffers were allocated on the device. The observed maximum bandwidth in the -mem_alloc_type device case was 24,020 MB/s versus 27 MB/s for the CPU buffer case.


To see the amount of data transferred between host and device one may use Intel® VTune™ Profiler’s GPU Offload analysis. Here Host-to-Device and Device-to-Host transfer times and transfer volumes are visible under the Graphics tab, as shown in the next figure. The following command line was used for running the GPU Offload analysis:
$ I_MPI_DEBUG=3 I_MPI_OFFLOAD=1
  mpiexec.hydra -n 4 -ppn 4 -f
  hostfile -gtool "vtune -collect gpu-offload -knob
  collect-host-gpu-bandwidth=true -r ./vtune_data3:0" IMB-MPI1-GPU
  allreduce -npmin 4 -iter 200 -iter_policy off

The purpose of this sub-section was to demonstrate the use of analysis tools in the context of MPI applications running in a heterogeneous environment. For more details on the various GPU specific capabilities of Intel® VTuneTM Profiler, please refer to Intel® VTune™ Profiler User Guide. One can use analysis/debug tools like Intel® Advisor, Intel® Inspector, GDB, etc. with MPI applications using the -gtool flag as demonstrated earlier. Please refer to their respective user guides Intel® Advisor User Guide, Intel® Inspector User Guide for Linux for more details.
Recommendations
It is a good practice to reuse the same GPU buffers in MPI communications as much as possible. Buffer creation in the Intel® MPI Library is an expensive operation and unnecessary allocation and deallocation of buffers must be avoided.
If your application uses several GPU buffers for non-blocking point-to-point operations, it is possible to increase the number of parallel buffers used by Intel® MPI Library for better performance. An environment variable named I_MPI_OFFLOAD_BUFFER_NUM is available for this purpose. Its default value is 4, i.e. Intel® MPI Library can handle 4 user’s device buffers in parallel. However, increasing the value of this variable also increases memory consumption.
If your application uses large device buffers, then increasing the size of the scratch buffers used by Intel® MPI Library might improve performance in some cases. An environment variable named I_MPI_OFFLOAD_BUFFER_SIZE is available for this purpose. Its default value is 8 MB. Increasing the value of this variable will also result in increased memory consumption.
In the GPU aware model, Intel® MPI Library uses pipelining for better performance. This technique, however, is better suited for large message sizes and an environment variable called I_MPI_OFFLOAD_PIPELINE_THRESHOLD is available to control when pipelining algorithm is activated. The default value for this variable is 524288 bytes. Users may optimize this control for the value best suited in their environments.
Another variable called I_MPI_OFFLOAD_CACHE_TOTAL_MAX_SIZE is available to increase the size of all internal caches used by Intel® MPI Library. Its default value is 67108864 bytes. If an application uses many GPU buffers, it might not be possible to cache all of them and increasing the value of this variable can potentially improve performance.