Visible to Intel only — GUID: GUID-BF1A72F1-E746-465F-B2AB-04C8A38ABE52
Visible to Intel only — GUID: GUID-BF1A72F1-E746-465F-B2AB-04C8A38ABE52
Performance Analysis with Intel® Graphics Performance Analyzers
Introduction
Intel® Graphics Performance Analyzers (Intel® GPA)
Intel® GPA is a performance analysis tool suite for analysis of applications run on single and multi-CPU platforms as well as single and multi-GPU platforms. It offers detailed analysis of data both visually and via scripting.
Intel® GPA consists of 4 GUI tools and a command line tool.
GUI Tools
Graphics Monitor - hub of Intel® GPA tools for selecting options and starting trace and frame captures.
System Analyzer - live analysis of CPU and GPU activity.
Graphics Trace Analyzer - deep analysis of CPU/GPU interactions during a capture of a few seconds of data.
Graphics Frame Analyzer - deep analysis of GPU activity in one or more frames.
Command Line Interface Tool
Intel® GPA Framework - scriptable command line interface allowing the capture and analysis of extensive data from one or more frames.
This chapter focuses on the functionality of Graphics Frame Analyzer for the deep view it provides into GPU behavior.
(Note: Intel® GPA Framework can be used to capture the same data as it is the backend of Graphics Frame Analyzer. In addition Intel® GPA Framework can be used to automate profiling work.)
Graphics Frame Analyzer Features
Some of the useful features of Graphics Frame Analyzer are:
Immediately see which frame of a set of frames takes longest.
Use Advanced Profiling Mode to automatically calculate your application’s hottest bottlenecks based both on pipeline state and GPU metrics so that optimizing for one frame may optimize multiple parts of your application.
Geometry - wire frame and solid:
in seconds you can see if you have drawn outside of your screen view.
View the geometry at any angle, dynamically.
Textures
Visualize textures draw call by draw call.
See if a draw call with a long duration is drawing an insignificant part of the frame.
Shaders
See which shader code lines take the most time.
See how many times each DXR (DirectX Raytracing) shader is called, as well as shader Vector Engine occupancy.
Render State Experiments - at the push of a button simplify textures or pixels or disable events to help locate the causes of bottlenecks, immediately seeing the changes in the metrics and other data.
Supported APIs
Direct3D 11
Direct3D 12 (including DirectX 12 Ultimate)
Vulkan
Execution Unit Stall, Active and Throughput
Graphics Frame Analyzer is a powerful tool that can be used by novice and expert alike to take a quick look at frame duration, API calls, resource data and event data. Understanding more about the meaning of each data element levels you up making it easier to root cause performance issues.
Execution Stall, Execution Active, Execution Throughput
Knowing how to interpret the interrelationships of these 3 data elements can take you much further in your ability to understand the interworking of your applications with respect to the GPU(s).
EU, XVE (Xe Vector Engine), and XMX
As discussed in the * Intel® Xe GPU Architecture * section of this document, in Xe-LP and prior generations of Intel® GPUs the EU - execution unit - is the compute unit of the GPU. In Xe-HPG and Xe-HPC we introduced the Xe-core as the compute unit. For these latter platforms each Xe-core consists of ALUs (arithmetic logic units) - 8 vector engines (XVE) and 8 matrix extensions (XMX).
In Graphics Frame Analyzer, if you are running on Xe-LP or earlier architecture, you will see EU Active, EU Stall and EU Throughput data labels. On newer architecture you will see XVE Active, XVE Stall and XVE Throughput data labels. Here we use Xe-LP as our reference architecture, thus we will refer to the EU. But understand that whether it is the EU or the XVE, the Stall/Active/Throughput relationships affect performance in the same ways.
Understanding these 3 data elements
First, let’s see what it looks like to drill down from the entire Xe-LP unit with its 96 EUs into a single EU. The General Register File (GRF) on each EU of this particular GPU holds 7 threads. Figure 1 shows the zoom in from the entire GPU to a single EU.

Let’s take a closer look at the details of the EU. In Figure 2, of the elements shown, we will focus primarily on the 7 thread slots of the GRF, addressing the importance of the thread interactions with the SEND unit and the 2 ALUs.
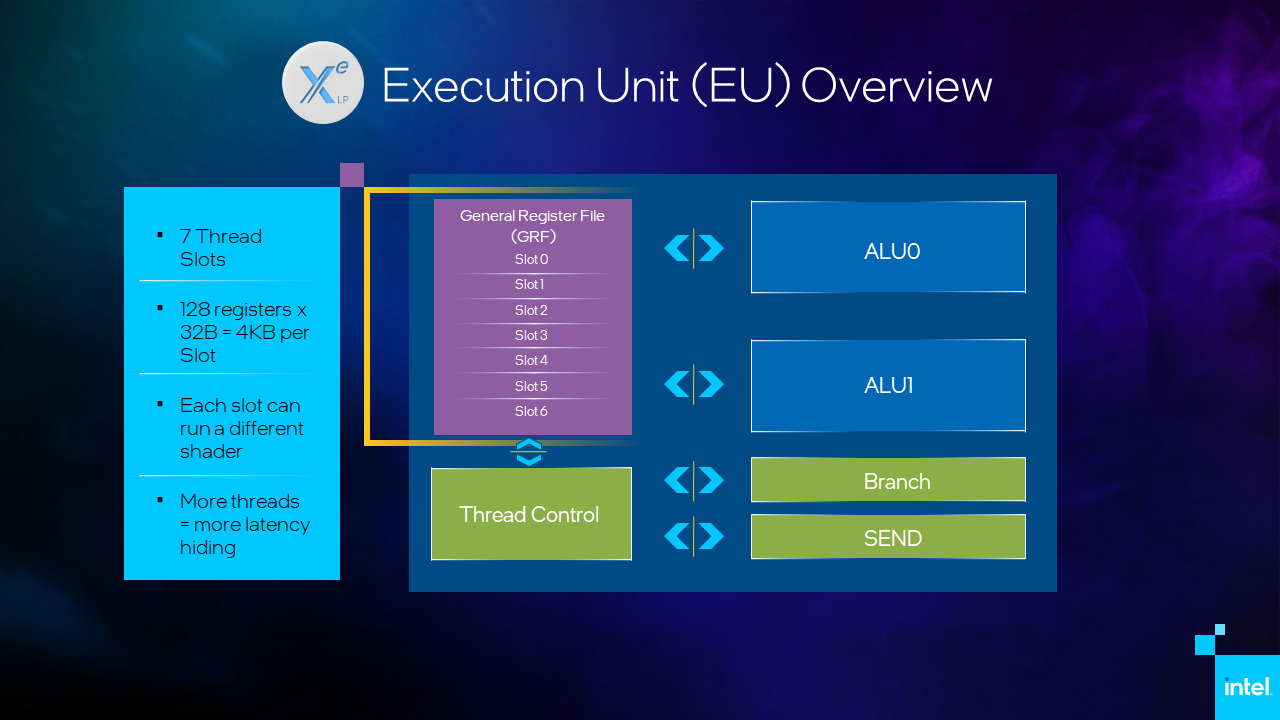
Now let’s look at a threading scenario. Figure 3 shows the contents of the GRF. We see that the GRF of this EU is loaded with only one thread in this instant. We see that single thread executing for some quantity of time. This means that one or both of the ALUs are invoked to execute instructions. At some point that thread needs to either read or write data, which activates the SEND unit. While the thread waits for the read/write to complete, the EU is stalled - it has a thread loaded but nothing to compute during that time.
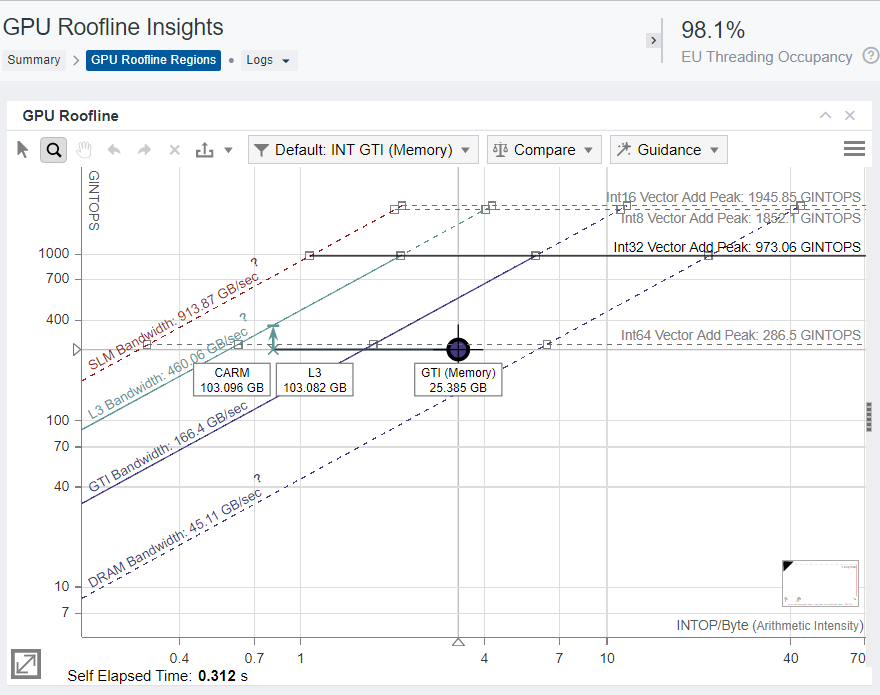
Augmenting this scenario, in Figure 4 there is a second thread in the EU. If there is a second thread loaded into the GRF of this EU, then, at the time when the first thread invokes the SEND unit, instead of stalling execution, the EU begins executing the instructions of the second thread. When that second thread invokes a command requiring the SEND unit, the EU becomes stalled until the first thread is able to continue. Had there been a third thread in this EU or if the first SEND returned sooner, all latency may have been hidden, resulting in thread latency, but no stall during this time for this EU.

Terminology
For the following definitions the resulting data calculated
is the average across all EUs;
consists of both the full frame data and the data for the selected portion of the frame. The selection may be a single call or a set of calls, or even a set of frames.
Idle
EU Idle is the percentage of time when no thread is loaded.
Active
EU Active is the percentage of time when ALU0 or ALU1 were executing some instruction. It should be as high as possible; a low value is caused either by a lot of stalls or EUs being idle.
Stall
EU Stall is the percentage of time, when one or more threads are loaded but none of them are able to execute because they are waiting for a read or write.
Thread Occupancy
EU Thread Occupancy is the percentage of occupied GRF slots (threads loaded). This generally should be as high as possible. If the EU Thread Occupancy value is low, this indicates either a bottleneck in preceding HW blocks, such as vertex fetch or thread dispatch, or, for compute shaders it indicates a suboptimal SIMD-width or Shared Local Memory usage.
If only a single thread is executing on each of the 96 EUs, then 1 of 7 slots/EU is occupied, resulting in thread occupancy of 1/7 (14%).
If 2 EUs have no threads loaded (they are idle) but the other 94 EUs have 6 threads loaded, we have occupancy = (0 + 0 + 6*94)/672 = 84%.
The Thread Occupancy values you will see in Graphics Frame Analyzer indicate the average occupancy across all EUs over the time selected. Though other hardware may have a different number of EUs or XVEs, the calculations are over all execution units. For example, below, on the left, you see a frame where over the entire frame duration of 6ms, though thread occupancy fluctuated during that 6ms, the average over that time for all 96 EUs is 77%. We can also look at thread occupancy over a part of the frame duration. Below, on the right, we select the 3 most time-consuming draw calls and see that during the 1.9ms that it took to execute these bits of the application, thread occupancy is 85.3%.

Graphics Frame Analyzer
View this data in Intel® GPA’s Graphics Frame Analyzer. For usage, see our 8 short videos and/or their corresponding articles. Video Series: An In-Depth Look at Graphics Frame Analyzer (intel.com)
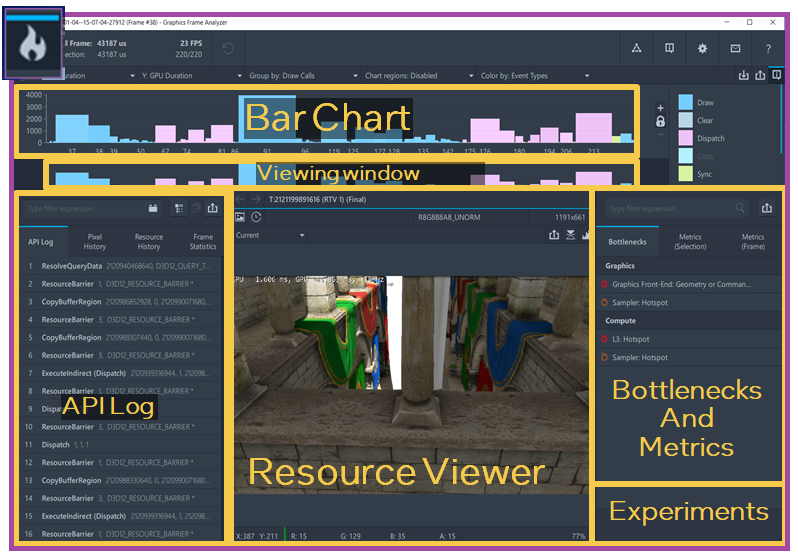
In Graphics Frame Analyzer after opening a frame, you will see a view such as that in Figure 5. If you look at the data just after opening the frame, you will see data percentage values for the entire frame. That means the percentages averaged over all 96 EUs over the frame time for data such as Active, Stall and Throughput.
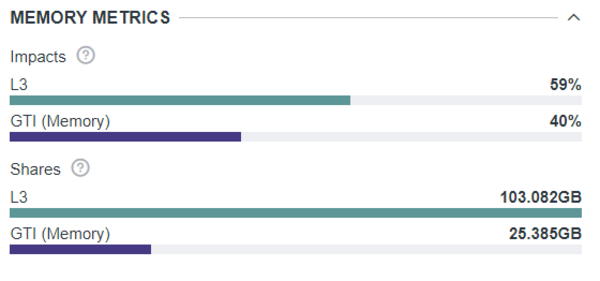
You can then select a single draw call or a set of calls to see that same data recalculated for the part of the frame you have selected.
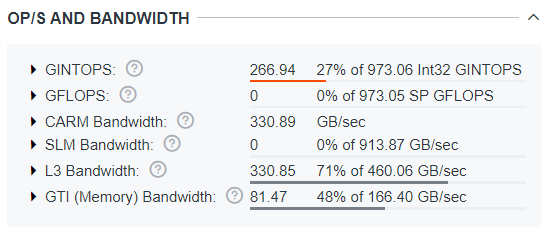
Additionally, if you captured a stream, it will open in multi-frame view. From there you can select a single frame or multiple frames. If you select multiple frames the data calculated will be the aggregate of the date from all selected frames.
While it is important to understand how the GPU works and what the metrics mean for efficient profiling, you don’t need to analyze each draw call in your frame manually in order to understand the problem type. To help with this sort of analysis, Intel® GPA provides automatic hotspot analysis - Advanced Profiling Mode.
Hotspot Analysis
Now that we have some understanding of the EU architecture, let’s look at how that knowledge manifests in the profiler.
When you enable Advanced Profiling Mode Graphics, Graphics Frame Analyzer delineates bottlenecks by bottleneck type and pipeline state. This categorization provides the additional benefit of a fix for one issue often fixing not only the local issue, but rather an entire category of issues.
In Graphics Frame Analyzer enable Hotspot Analysis by clicking on the button on the top left of the tool - shown in Fig 7. The Bar Chart across the top then shows the bottlenecks, and the API Log in the left panel changes to show the bottleneck types. When you click on a bottleneck the metrics viewer will show more details about the bottleneck, with metrics descriptions and suggestions to alleviate the bottleneck.
Hotspot: L2 Cache
Characterization of an L2 Cache Hotspot
When the application has high thread occupancy, close to 90%, that is good. But if the high thread occupancy is coupled with stall, greater than 5-10%, you may have an L2 Cache bottleneck.
With a frame open in Graphics Frame Analyzer, look at the Metrics Viewer Panel on the right, enlarged in Fig. x. Occupancy is more than 90%, but there is still a stall in the EU, which means that EU threads are waiting for some data from memory.
Shader Profiler
For further analysis use the Shader Profiler to see per-instruction execution latencies. As you already know latency is not always equal to stall. However, an instruction with higher latency has a higher probability to cause a stall. And, therefore, when dealing with an EU Stall bottleneck, Shader Profiler gives a good approximation of what instructions most likely caused the stall.
Enable Shader Profiler
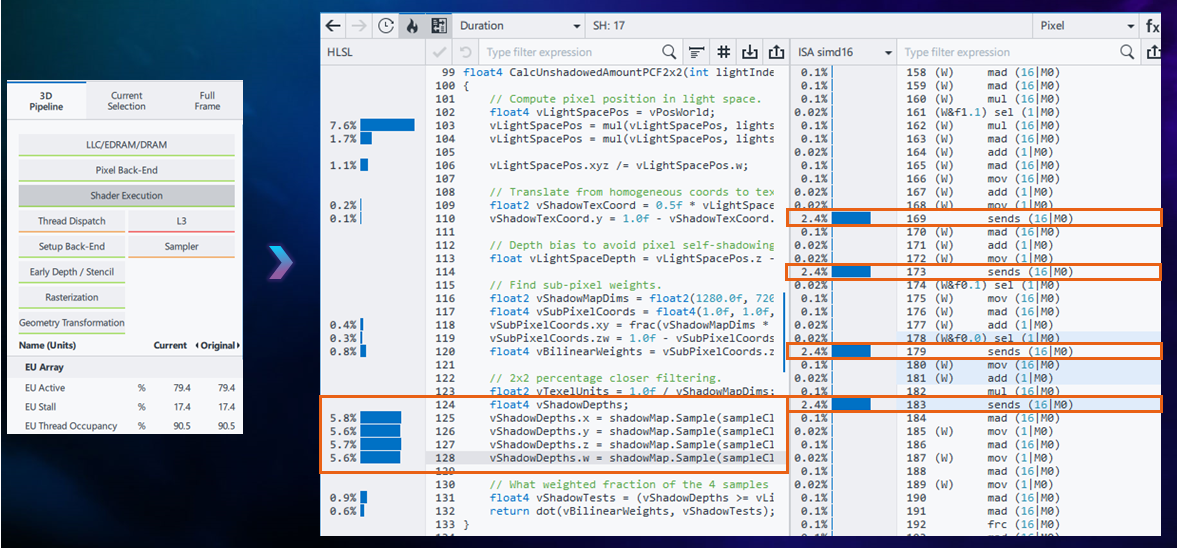
Access the shader profiler by doing the following. Click on any shader in the Resource List, in this case SH:17, to display the shader code in the Resource Panel. Then click the flame button at the top of the Resource Pane to see the shader code with the lines taking the most time annotated with the timings, toggle between execution count and duration (percentage of frame time consumed).
Map Shader Code to Assembly Code
For a potential L2 Cache bottleneck, you will also want to see the assembly code, where you will find the send commands from the Send Unit. Click the  button in the Resource Panel above the shader code to see the mapping from the shader code to the assembly code.
Identify the Root Cause of the L2 Bottleneck
To find the root cause of an L2 Cache bottleneck, scroll through the assembly code, looking for the send instructions with the longest duration. Then identify which shader source portions caused them.
In the case of the application being profiled in Fig x, above, the CalcUnshadowedAmountPCF2x2 function which samples from ShadowMap and reads the constant buffer is cause of this bottleneck.
Hotspot: Shader Execution
Characterization of a Shader Execution Bottleneck
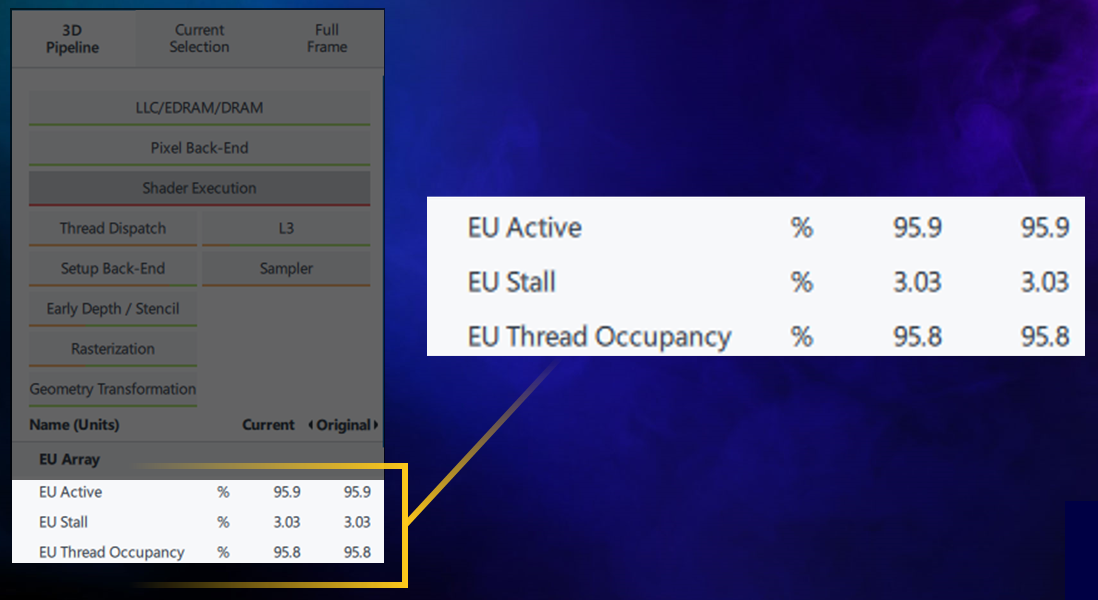
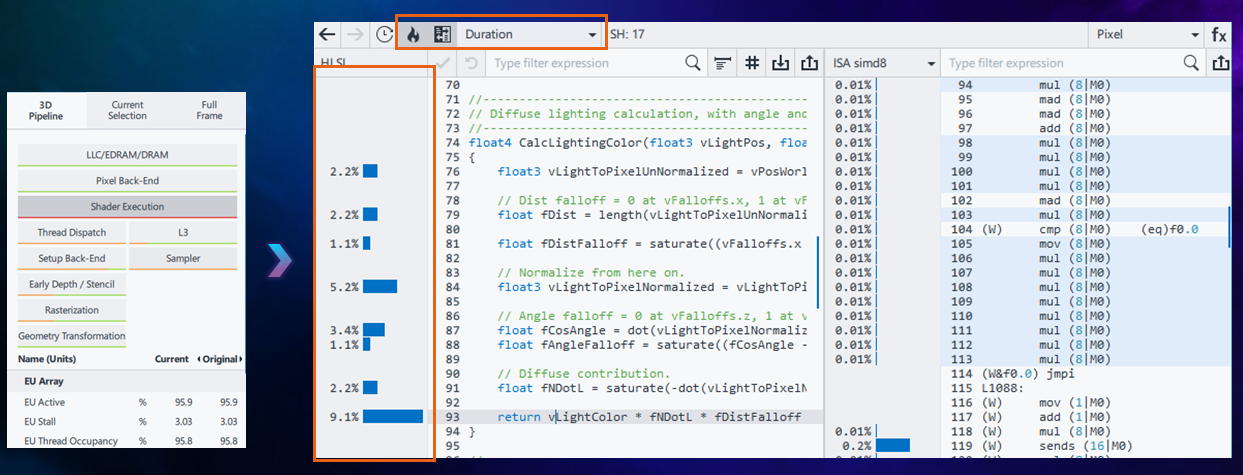
A Shader Execution bottleneck is characterized by very high thread occupancy and very low stall time. These are good. However, if the application reduced execution time, it is necessary to optimize the shader code itself.
Identify the Root Cause of the Shader Execution Bottleneck
For a shader execution bottleneck, it is necessary to analyze the hotspots in shader source code caused by arithmetic operations. Find these by toggling to Duration Mode in the shader profiler, then scroll through the code to find the lines of shader code that take exceedingly long. CalcLightingColor does calculations involving both simple and transcendental operations. Fig x shows that this function in this single shader consumes about 20% of the total frame time. In order to resolve this bottleneck this algorithm must be optimized.
Hotspot: Thread Dispatch
Characterization of a Thread Dispatch Bottleneck
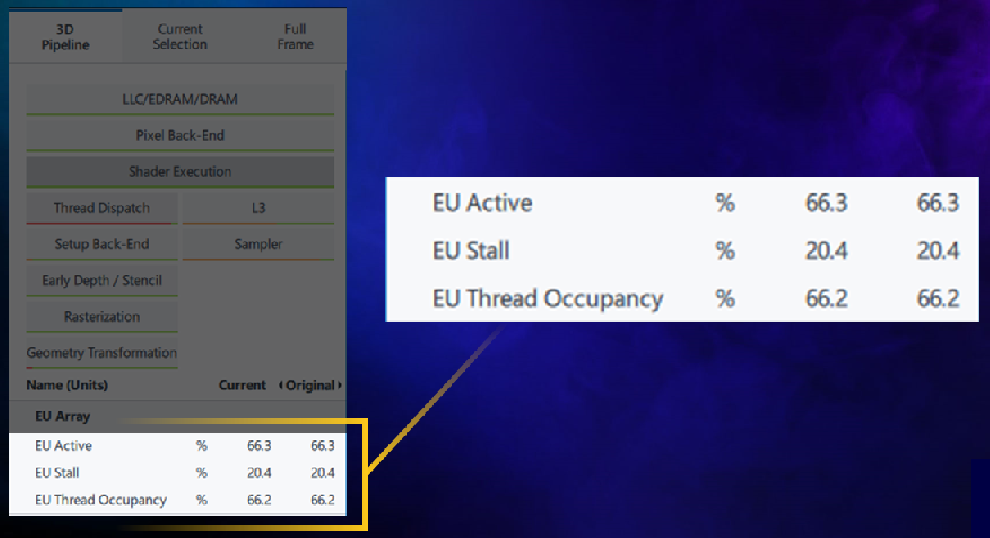
In this final example of hotspot analysis there is a sequence of draw calls which have a Thread Dispatch bottleneck. In this particular case we have a rather high stall rate (20%) and low thread occupancy (66%). As stated earlier, low occupancy may be caused by an insufficient number of threads loaded on the EU. Thus, instead of directly fixing stall time in shader code, it is necessary, instead, to increase the overall EU Occupancy.
Identify the Root Cause of the Thread Dispatch Bottleneck
Which is better, SIMD8 or SIMD16?
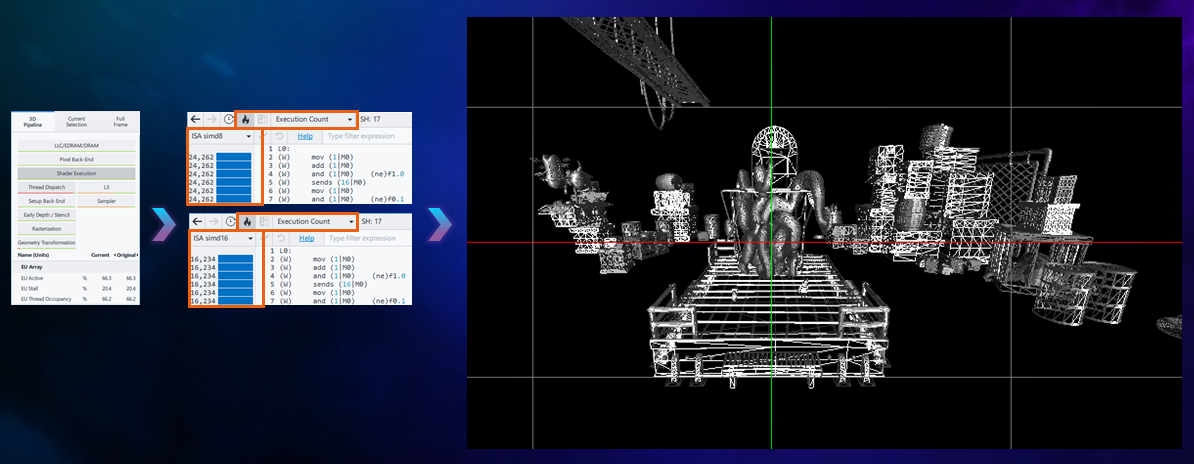
Open Shader Profiler, but in Execution Count mode rather than Duration mode which shows how many times each instruction was executed. In Fig x notice that the pixel shader has been compiled into both SIMD8 and SIMD16. Shader Profiler shows that each instruction in the SIMD8 version was executed 24,000 times, while instructions in SIMD16 were executed 16,000 times - a 1.5 times difference!
It is preferable to have more SIMD16 threads, as they perform twice as many operations per single dispatch, compared to SIMD8 threads. Why so many SIMD8 dispatches? And why should there be 2 SIMD versions for the Pixel Shader?
Examine the Geometry
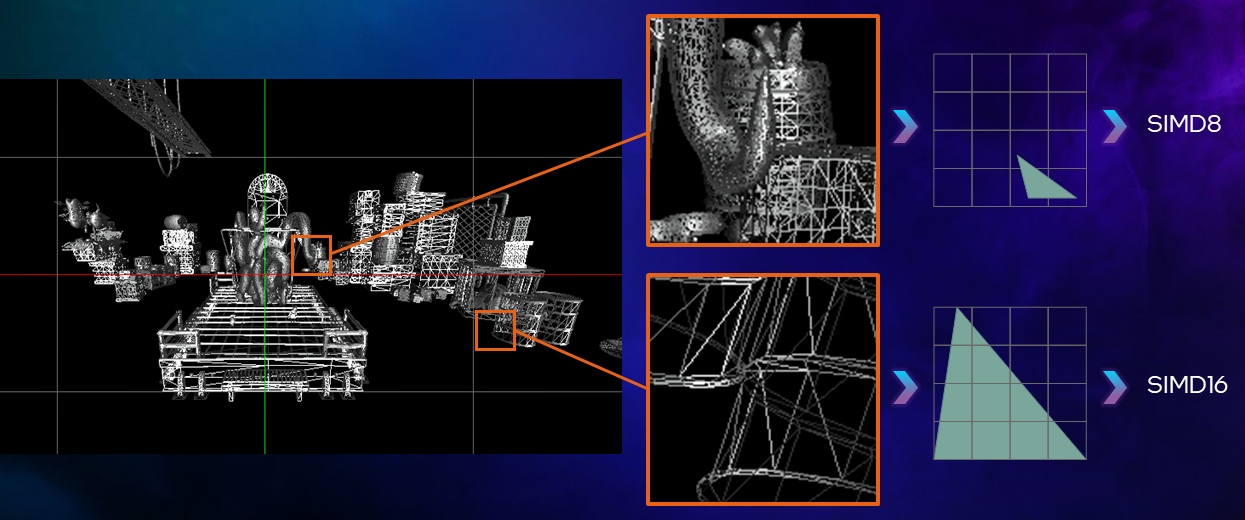
The geometry for these draw calls is rather fine-grained. The observed anomaly is a result of how the GPU handles pixel shading. The shader compiler produced two SIMD versions, SIMD8 and SIMD16. This is required so that the pixel shader dispatcher can choose which one to execute based on the rasterization result. It is important to know that hardware does not shade pixels one at a time. Instead shading happens in groups. A single pixel shader hardware thread shades 16 pixels at a time for SIMD16. With SIMD16, if a primitive is rasterized into very few or just a single pixel, then the GPU will still shade 16 pixels and will discard all those which were unnecessary. Therefore, in order to discard less, the pixel shader dispatcher schedules SIMD8 for very small primitives. This is the case here. A large number of highly-detailed geometry (many small primitives) produced a huge number of SIMD8 invocations. As you may guess, in order to fix such a performance problem you need to use geometry LODs in your game
Summary
Bottleneck Type |
Characterization |
|---|---|
L2 Cache |
High occupancy High stall |
Shader Execution |
High occupancy Low stall |
Thread Dispatch |
High stall Low occupancy |
As shown above, different scenarios require different approaches. At times it is best to speed up CPU work to fully populate the GPU. Other times it is best to optimize shader code. And still others it might be best to change formats, dimensions or layouts of primitives. For each scenario, Graphics Frame Analyzer facilitates analysis of resources to assist developers to make informed decisions about how to optimize frame rate of their applications.
For more ways to optimize GPU performance using Intel® GPA, see Intel® GPA Use Cases as well as Deep Dives and Quick Tips.