Visible to Intel only — GUID: GUID-C7B9FDBC-0FC3-421C-9E9E-8EE5950E9797
Visible to Intel only — GUID: GUID-C7B9FDBC-0FC3-421C-9E9E-8EE5950E9797
Metrics Pane
In the Metrics pane, you can analyze hardware and Application Programming Inferface (API) metrics for specific events. The Metrics pane is hidden if metrics are not available on your platform.
Analyzing the metrics can help you understand and prove the correctness of the rendering algorithms, as well as understand performance and bottlenecks down to specific GPU pipeline stages or hardware unit. When nothing is selected, the Graphics Frame Analyzer displays the total values for the entire frame.
When you experiment with the frame, metrics update immediately to reflect the changes. To switch between the different metrics types, select the corresponding tabs on the Metrics pane: Bottlenecks, Metrics (Selection), or Metrics (Frame).
Bottlenecks
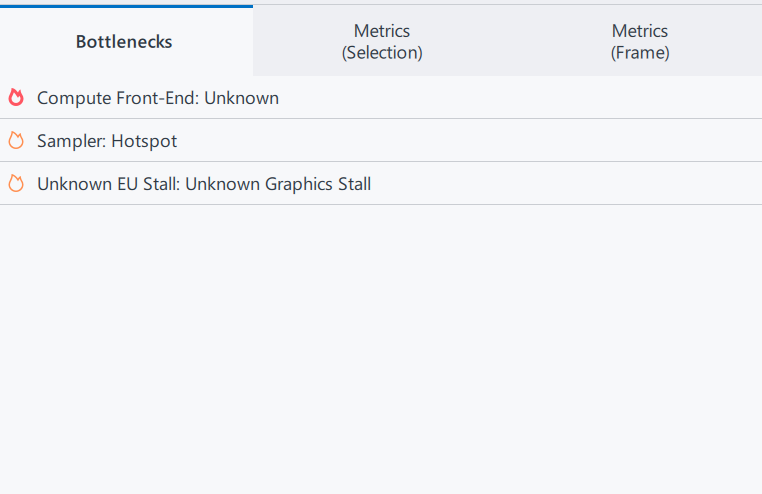
The Bottlenecks tab group display all automatically detected GPU bottlenecks and related metrics.

To see the cause of the bottlenecks, hints, and related metrics, click the corresponding bottleneck. Bottlenecks are marked with a colored hot spot icon on the left:
 indicates a primary bottleneck.
 indicates a secondary, or potential, bottleneck.
When the ![]() Advanced Profiling mode is enabled, the following additional metrics are displayed to the right of the bottleneck name:
Advanced Profiling mode is enabled, the following additional metrics are displayed to the right of the bottleneck name:
Total duration, in microseconds, of all API calls associated with the bottleneck.
The percentage of time spent on API calls that have this bottleneck compared to the time spent on all API calls with primary (red) or secondary (orange) bottlenecks.
Metrics (Selection)
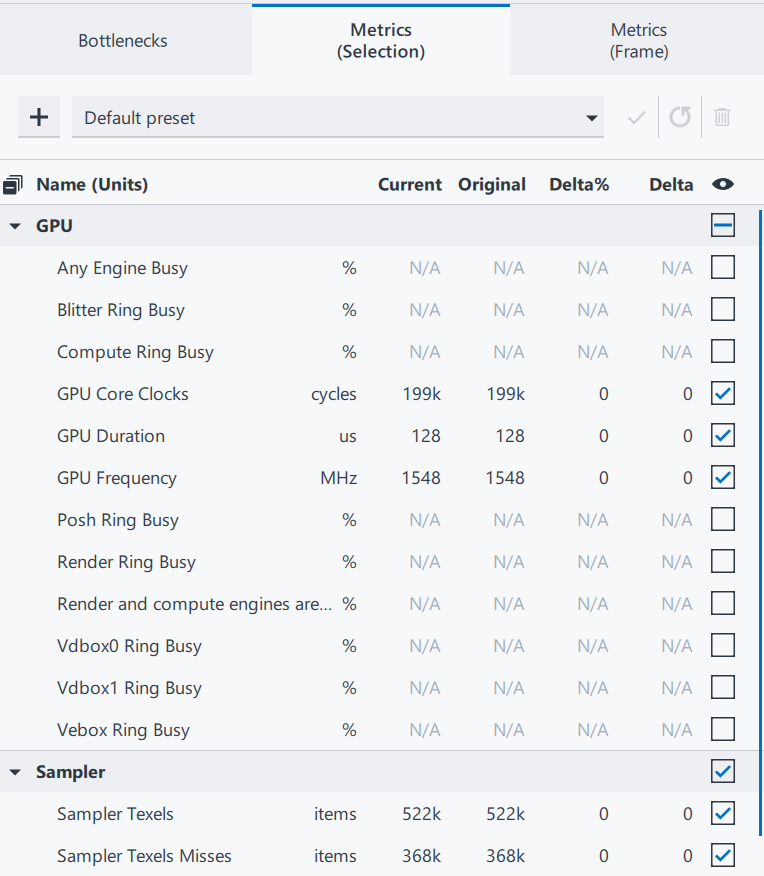
The Metrics (Selection) tab includes metrics for the current selection only.

The metrics are collected into several high-level groups, each group containing multiple metrics appropriate to that grouping.
If all the metrics in the group are selected, the group name checkbox shows a checkmark ![]() . If only some of the metrics in the group are selected, the group name checkbox shows a line
. If only some of the metrics in the group are selected, the group name checkbox shows a line ![]() .
.
In this view you can:
expand or collapse individual groups by toggling the
 arrow next to the metrics group name.
select or deselect all the metrics in a group by selecting or deselecting the checkbox in the group heading.
collapse all the groups by clicking
 Collapse All Groups.
select an individual metric by clicking the checkbox in the metrics row.
hover over a metric to see the full metric name and description.
toggle between seeing all possible groups and metrics or only the selected groups and metrics by clicking
 Hide unselected metrics. (The icon toggles to
  Show unselected metrics. You can toggle between states.)
export metrics results for the selected metrics to a .csv file by clicking
 Export Metrics Values. (The icon toggles to
  showing progress and canceling the export).NOTE:After applying the export, metrics are not calculated in the Metrics pane until the export is complete.
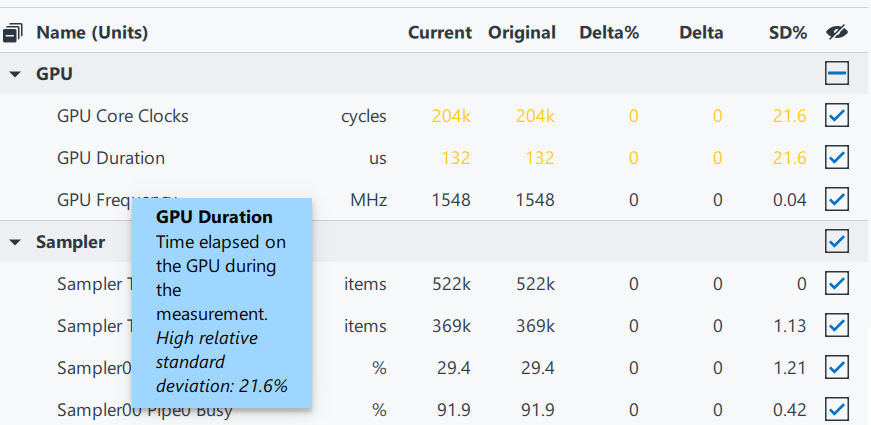
If you enable the Collect fast/stable metrics, metrics will be colored if they have a significant standard deviation. A particular value of its standard deviation can be viewed in the SD% column or by hovering over the metric.

Metrics (Frame)
The Metrics (Frame) tab includes all metrics for the full frame.
The general behaviors described above for the Metrics (Selection) tab apply to the Metrics (Frame) tab.
Finding Metrics and Changing Metrics Presets
Searching for and modifying metrics applies only to the Metrics (Selection) and Metrics (Frame) tabs.
Searching for Metrics
You can search for metrics by typing a portion of the metric name into the Type Filter Expression field.

The results include any near matches to the string you enter in the same tab. The relevant results will include highlighted characters that matched the search text, and the nearest match will appear at the top of the search results.
Click x in the search field to clear the text and revert to the previous view.
Working with Metrics Presets
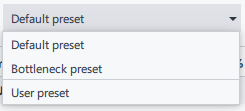
Only two presets exist by default: Default preset and Bottleneck preset; however, if the Bottleneck analysis does not detect any metrics related to the preset, the Bottleneck preset will not appear.

User-created presets are separated from the system presets.
You can modify the Default preset, but you cannot modify the Bottleneck preset. You cannot delete either of the system presets.
Modify the Default preset by following these general steps.
Select the Default preset .
Expand or collapse the metrics groups, and select any metrics you want to add to the preset, deselect any you do not want.
Click
 Apply Changes when you have completed your selections.
Create a new preset by following these general steps.
Click
 Create New Preset to copy the current state of the selected metrics.
Enter a new preset name in the Type new preset name field and click
 Apply Changes.
Select any metrics you want to add to the new preset. Deselect any you do not want.
Click
 Apply Changes when you completed your selections.
The saved preset .json files are in %USERPROFILE%\Documents\GPA\metrics_presets (Windows* OS). You can copy these and reuse them as needed.
If you load a preset and notice red text, the red text indicates an error matching the parameters to the current GPU. Log files in %USERPROFILE%\Documents\GPA\Logs (Windows OS) can help you find the error cause.