A newer version of this document is available. Customers should click here to go to the newest version.
Graphics Monitor
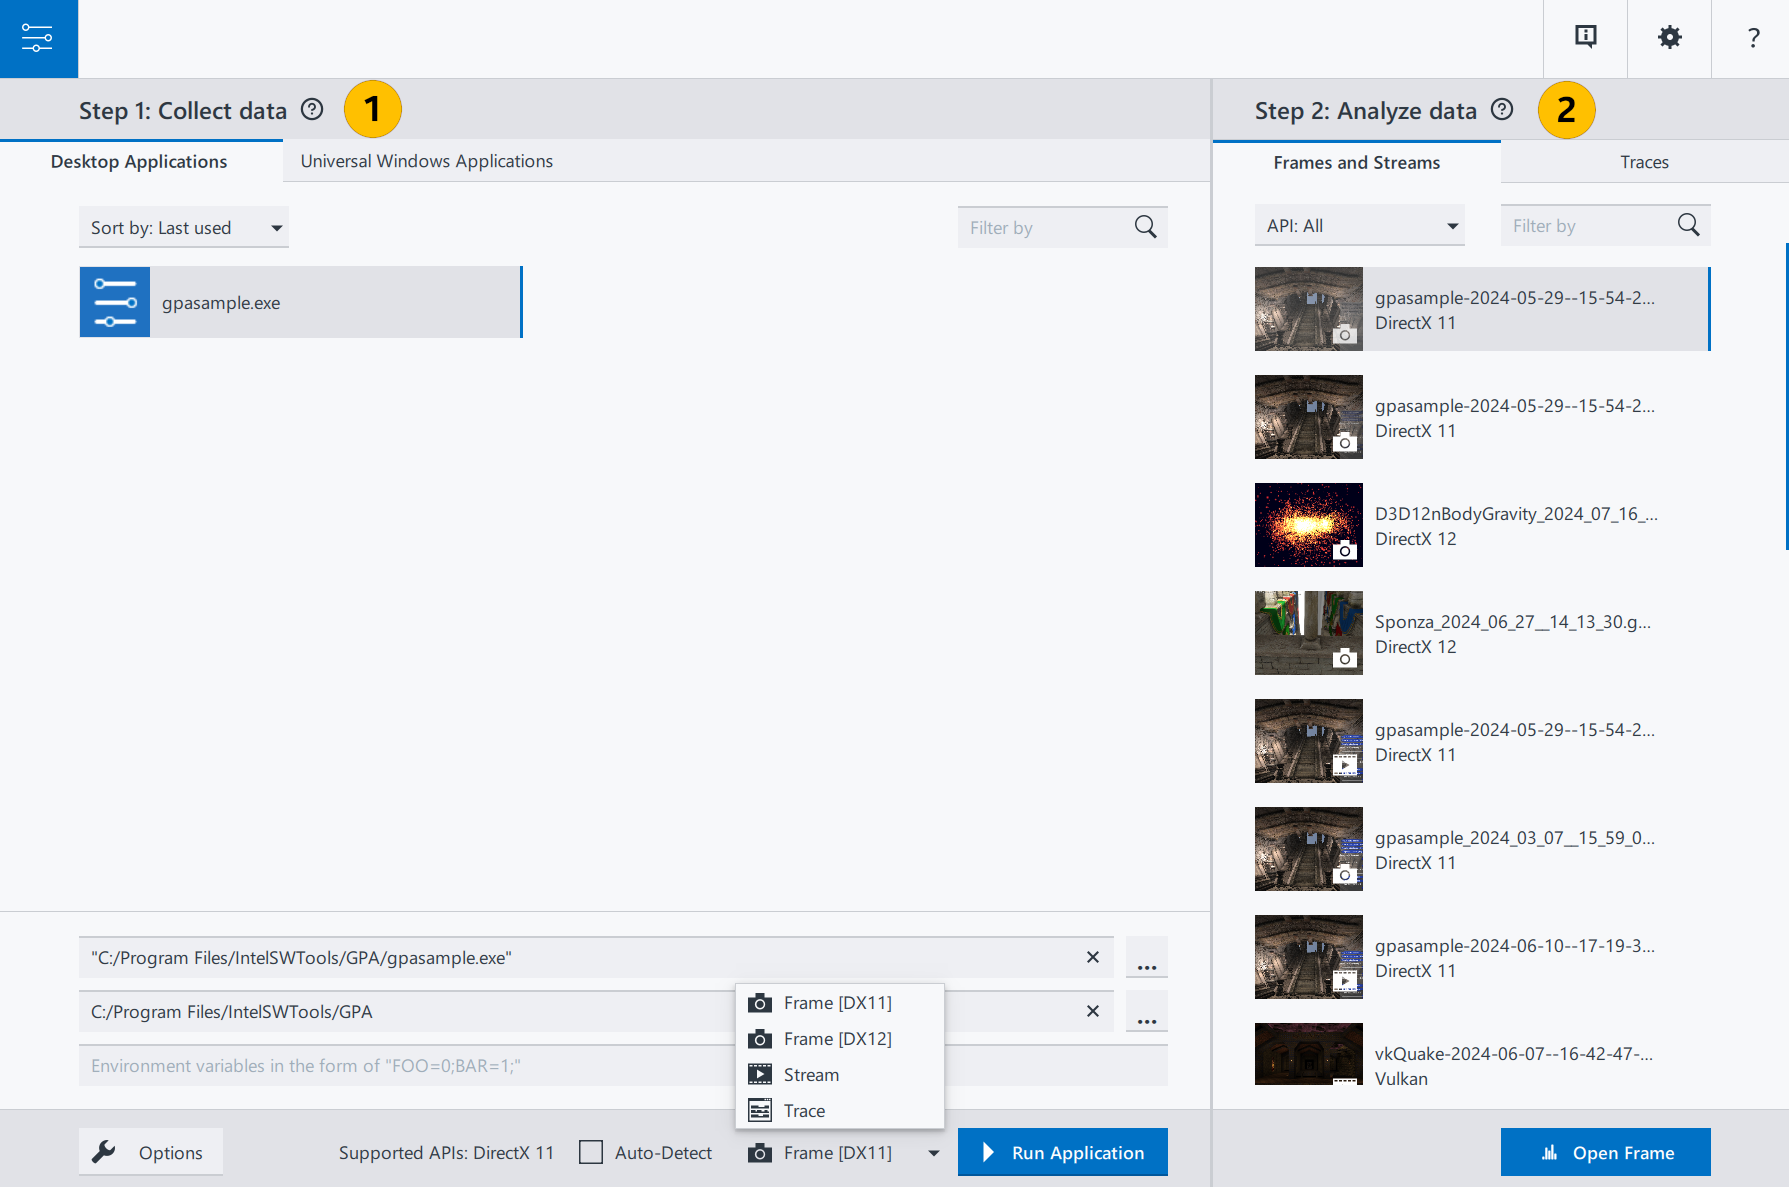
Use the Graphics Monitor configuration window to specify and run a graphics application for analysis with Intel® GPA.
To access the Graphics Monitor configuration window, right-click the ![]() Graphics Monitor icon in the taskbar notification area, and select Graphics Monitor.
Graphics Monitor icon in the taskbar notification area, and select Graphics Monitor.

Follow Step 1 to collect data (
 ):
):1.1. Select a data collection type:
Frame [DX11]: choose this mode to monitor real-time metrics and capture a frame for DirectX 11 applications.
Frame [DX12]: choose this mode to monitor real-time metrics and capture a frame for DirectX 12 applications. This mode supports DirectX 12 Ultimate features, like Mesh Shading and Ray Tracing.
Stream: choose this mode to capture a sequence of frames. This can be useful for isolating sporadic performance problems that only affect a subset of frames.
Trace: choose this mode to monitor real-time metrics and capture a trace.
1.2. Select an application for analysis:
Enables you to choose and start a desktop application for analysis.
Enables you to choose and start a universal Windows* application for analysis.
1.3. Run the application by clicking the Run Application button.
Follow Step 2 to analyze data (
 ):
):2.1. Select the Frames and Streams tab to open captured frames and streams or select the Traces tab to open captured traces
Capture files thumbnails are marked with the following icons:
Frame:

Stream:

Trace:

Invalid file:

2.2. Open the captured file by double-clicking the thumbnail or by clicking Open Frame/Stream/Trace button.
Additionally, you can change the monitor settings in Control panel and in Configure Analysis Settings