Game Optimization Methodology
Optimizing a video game can be an overwhelming task when there is no clear direction. Without any starting information, it can be hard to even determine where to start. Learn how you can optimize your game in a clear and systematic manner using various Intel performance analysis tools.
Set Your Performance Goals
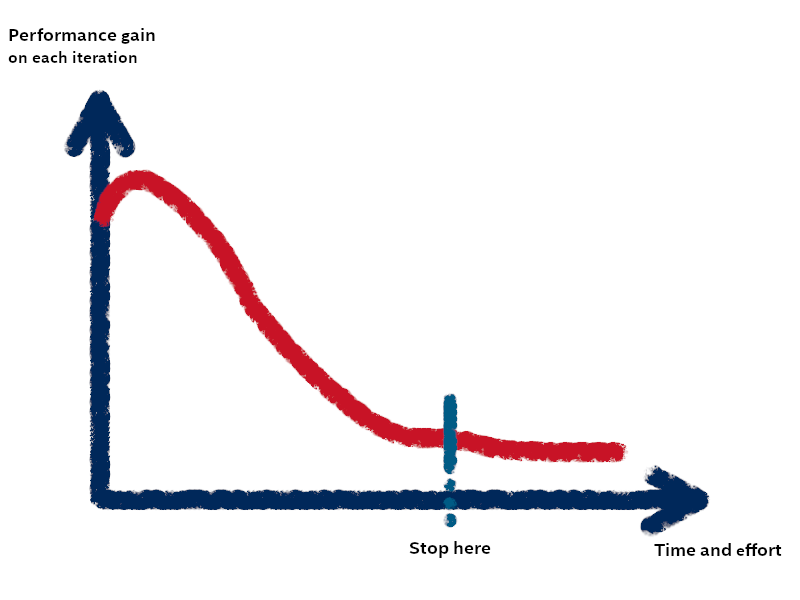
Strictly speaking, you can keep optimizing any piece of software endlessly, and the ratio of performance gain to time and effort keeps declining while you are optimizing an application. Therefore, it is necessary to set a clear performance goal and stop performing optimization when this goal is reached.

First, you need to consider the genre, style, and gameplay elements of your game. For a competitive first-person shooter, stable FPS and low input lag may be the key factors. For a slow-paced storytelling game, visual fidelity may outweigh the need for a >100 FPS value. A point-and-click adventure game with pre-rendered backgrounds may not require any graphics optimization at all.
You also need to consider your target audience and the kind of hardware these people might use. Are you targeting PC enthusiasts with top-level, high-performance hardware, or is your demographic comprised of gamers using laptops with integrated graphics? Several online game vendors can help, as they publish regular monthly and/or annual hardware and software survey results. One example of such global survey is the Steam* Hardware and Software Survey. Such surveys can offer great insight into the kinds of hardware and software real gamers use across the globe.
Together, these two factors will be deciding in setting your performance goals.
An example of a basic set of performance goals for a competitive first-person shooter may look like this:
A stable FPS value of >=120 FPS for smooth experience on 120 Hz monitors
Low input lag for precise targeting
Good server-side performance for fair gameplay and scoring
Flexible graphics options for maximum reach of people with different hardware
Game performs well and provides a smooth experience when tested on configurations selected based on own ideas about target audience and hardware surveys
General Optimization Workflow

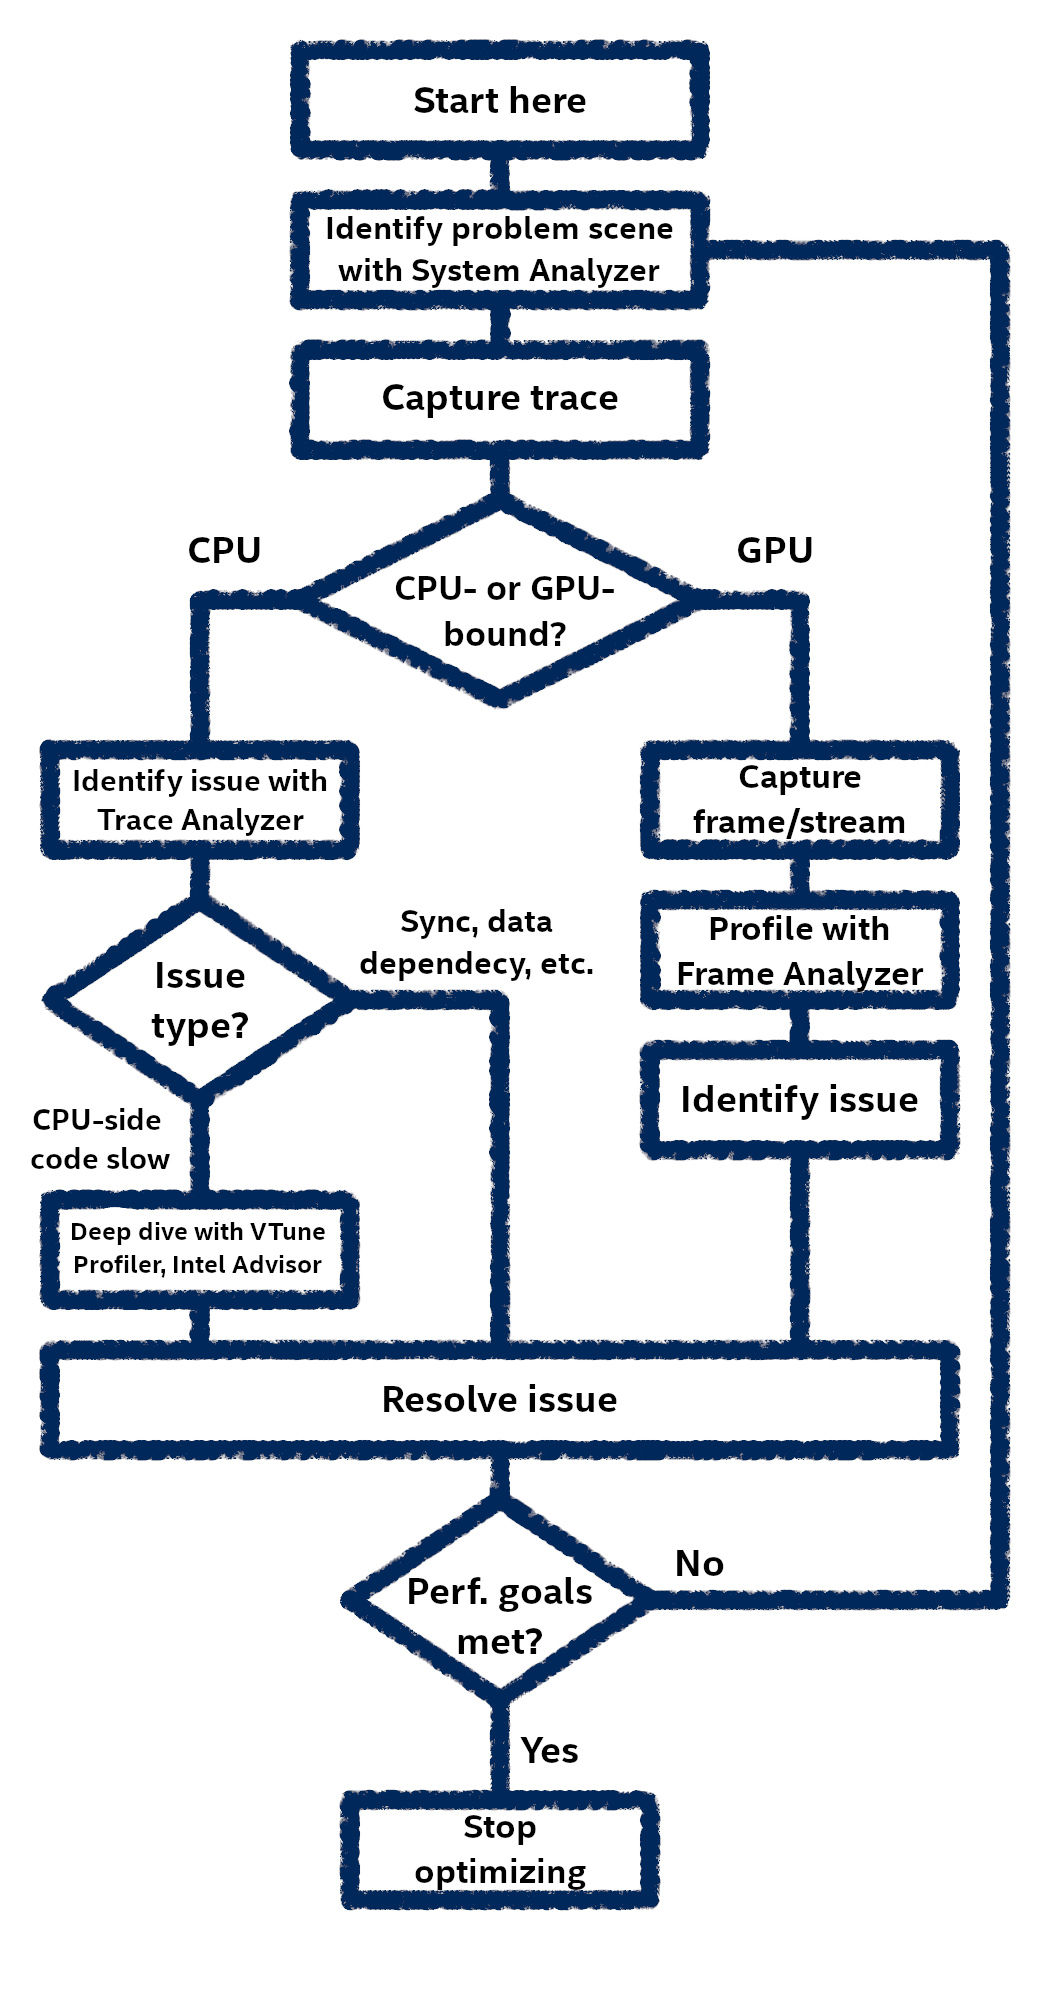
Optimization is an iterative process. When you have a game that does not perform up to expectations, your typical workflow may look like this:
Identify problematic scene.
Check if the game is CPU- or GPU-bound on this scene.
Identify main performance bottleneck.
Drill down and determine root cause.
Resolve issue.
Check if the game now meets your performance goals.
If it does, stop optimizing. If not, go to step 1.
How Intel Tools Can Help
Intel offers a variety of performance analysis tools that, together, cover all steps in this workflow.
The tools that can be the most useful are:
Intel® Graphics Performance Analyzers
A feature-rich set of tools that covers all graphics optimization and profiling needs.
Intel® VTune™ Profiler
A comprehensive tool for CPU performance analysis. Comes with a set of analysis types that cover all CPU optimization needs.
Intel® Advisor
A performance analysis tool with deep focus on threading and vectorization.
Before You Begin
Before you start optimizing a game, it is important to select an appropriate test system to use for performance profiling.
For performance profiling, use a balanced system where the CPU and GPU both belong to the same time period and price range. Align the test system specifications with your performance goals and target audience.
This is particularly important in one of the next steps, which is testing if the game is CPU- or GPU-bound. Profiling your game on a system with a top-notch CPU and an ultra-budget GPU will not yield a useful result, as the game will always be GPU-bound on such system. The same applies to powerful GPUs coupled with budget or obsolete CPUs: knowing that your game is CPU-bound on such systems is hardly representative of real-world scenarios.
Make sure to align the specifications of the test system with the target audience. A graphically simpler game oriented at storytelling should not be tested on ultra-high-performance hardware, as this unnecessarily cuts off a large portion of the audience with less sophisticated systems.
Identify Problematic Scene
Once you formulate your performance goals and configure a test system, you are ready to start with the optimization itself.
Most likely, you will realize that your game is only slow in certain situations.
Some possible examples are, ranging from obvious to more complex:
Looking at the floor/ground boosts FPS, looking elsewhere drops FPS to unsatisfactory levels.
Looking at a specific tree or bush model drops FPS dramatically.
Moving further away from that tree does not improve the situation.
Activating a light source, such as a flashlight, reduces performance significantly.
Game is slow for a minute after you enter a new location, then improves.
Game is slow to load specific models and textures.
Seemingly sporadic performance drops with no obvious explanation.
One tool that can help make finding problem scenes easier is the System Analyzer of Intel GPA. You can launch your game with the System Analyzer HUD enabled and see the current FPS value and up to four select metric graphs until you find a problematic spot.
You can also track multiple metrics in real time using the System Analyzer window, quickly capture frames or traces when facing a problem, and switch between metric sets to analyze other aspects of performance.
To start a game and attach System Analyzer, launch your game through the Graphics Monitor window. Make sure to launch your game in Trace mode, since a trace capture is required for the next step.
If the performance issues are sporadic and you find it hard to capture a trace at the right time, set up a trigger. A trigger will automatically capture a trace of frame when a certain condition is met.
Once you find a problematic scene or area, the next step is to capture a trace to determine if the game is CPU- or GPU-bound in this scene.
What is CPU- or GPU-bound
Once you identify a problematic scene, the next important step is to determine whether the game is lagging due to CPU or GPU limitations.
There are 2 potential scenarios:
CPU-bound
Description: the main limiting factor is the ability of the CPU to timely execute instructions that are supposed to be executed on each frame. The CPU is overwhelmed with one or more heavy tasks, such as game logic, physics, hit detection, etc.
Perception: in simplest form, this scenario is observed as combination of high CPU load and low GPU load.
GPU-bound
Description: the main limiting factor is the ability of the GPU to timely execute tasks that are supposed to be executed by the GPU on each frame, such as geometry transformation, shading, post processing, etc.
Perception: in simplest form, this scenario is observed as combination of low CPU load and high GPU load.
In both cases, the FPS value is low, and subjective experience is unsatisfactory.
Technically, depending on the specific system, your game will always be CPU- or GPU-bound. Once you reach your performance goals, this is not important. However, while performing optimizations, knowing this eliminates a lot of guesswork and gives a clear direction.
Determine if Game is CPU- or GPU-bound
To determine if your game is CPU- or GPU-bound, use the Trace Analyzer tool of Intel® GPA.
You first need to capture a trace. A trace is a file that contains detailed information on the execution of a program.
To capture a trace, you can use the Capture Trace button of System Analyzer or press Ctrl+Shift+T during gameplay.
Once you capture your trace, open it using the Trace Analyzer tool and look at the main view. You should see all activity, both on CPU and GPU, while the trace was collected. This includes all logical processors, application threads, and multiple GPU metrics.
In the simplest of cases:
CPU-bound: the logical processors are busy executing the application code most of the time, while the GPU is not loaded; for example, the GPU Busy (%) metric value is low.
GPU-bound: GPU metrics related to GPU occupation are high (such as GPU Busy (%), EU Active (%)), while the CPU cores are mostly idle.
Your case might not be as straightforward. For more details, see the full Trace Analyzer workflow.
If Game is CPU-bound
If your game is CPU-bound, it might be useful to try the following:
Annotate your CPU-side code with the :ref:` Instrumentation and Tracing Technology API (ITT API)<instrumentation-and-tracing-technology-apis>` to see tasks that take too long right in Trace Analyzer.
Use Intel® VTune™ Profiler to find your hotspot and optimize CPU utilization. Refer to the User Guide and Cookbook to see how this tool can help in your case.
Use Intel® Advisor if you suspect your application has a problem with threading and vectorization. Refer to the User Guide and Cookbook to see how this tool can help in your case.
Depending on the nature of your CPU-side issue, one or more of these tools can cover your CPU optimization needs.
Examples of possible issues that can lead to suboptimal CPU performance are:
Suboptimal game logic code. For example, the function responsible for mapping NPC positions to points on a map is implemented poorly, and each map refresh causes a slowdown of the entire game.
A multi-threaded game does not use synchronization properly, and CPU threads are idle most of the time.
Use the tools provided to isolate your hotspot and resolve the issue.
If Game is GPU-bound
If your game is GPU-bound, your next step is to capture a stream or a frame of the problematic scene to determine the root cause.
A frame is a capture of GPU activity during the process of rendering one frame. Open your frame in Frame Analyzer to get plenty of information on how a particular scene was rendered on the GPU.
If you find it hard to capture a frame at the right time, set up a trigger.
Frames are comprised of draw calls, which are calls to the graphics API to perform one action or another. Locate the lengthiest draw calls and determine their root cause using tips, experiments, and other features of Frame Analyzer.
Once you are looking at a frame in Frame Analyzer, you can experiment with the rendering pipeline to isolate a high-level bottleneck. For example, if you use the 2x2 Textures experiment, which replaces all textures with a 2x2 pixel square, and frame time drops dramatically, this could indicate that there are overly complex textures in this scene.
You can also find the heaviest instructions in your shader code and experiment with it on the fly, without changing the original game code.
If you suspect that the issue persists across multiple frames, try to capture a stream. A stream is a sequence of frames, each of which can be opened individually in Frame Analyzer.
See the full Frame Analyzer workflow for details.
Balance Fidelity and Performance

Depending on the nature of your GPU performance problem, you might consider whether simplifying an object model or texture to improve performance will sacrifice visual quality. The answer really depends on the nature of the problem.
Consider one of the examples above, where performance drops when a specific tree appears in view and does not improve when moving away from the tree.
The most probable causes of such a situation are:
The tree model is overly complex and has too many polygons. In this case, it might be best to simplify the model, sacrificing some visual quality for performance. It is highly likely that most players will not even notice the reduction in fidelity but will appreciate the performance increase.
The LOD for this tree is not set up properly. In this case, it is best to ensure LOD is properly enabled. There is no sacrifice in visual fidelity here, since, by nature, LOD reduces the visual quality of the model with increasing distance to the viewer.
To summarize, you can find yourself in two situations:
Performance improvement requires a sacrifice in visual quality
In this case, consider tweaking an object to see how the performance changes with changes to quality. If an unnoticeable reduction in quality results in a large performance improvement, it might be best to adopt the change.
Performance improvement does not require a sacrifice in visual quality
In this case, consider if your performance goals are met and if the implementation is difficult. Decide if the ratio of gain to implementation efforts is good enough and implement the fix based on this.