Visible to Intel only — GUID: GUID-BB6A3A95-53C2-49A7-8DA5-F1779450246C
Visible to Intel only — GUID: GUID-BB6A3A95-53C2-49A7-8DA5-F1779450246C
Control Panel
Use the Graphics Monitor control panel to configure general and appearance settings, and specify a list of remote systems for analysis.
The panel includes the following controls:
 System Information control provides information about the Intel® GPA version installed on the system and extended system information. You can copy the system information to the clipboard or save it to a .txt file.
 Settings control provides access to the Settings panel.
 Help control provides access to the Intel® GPA user guide (this document).
Settings Panel

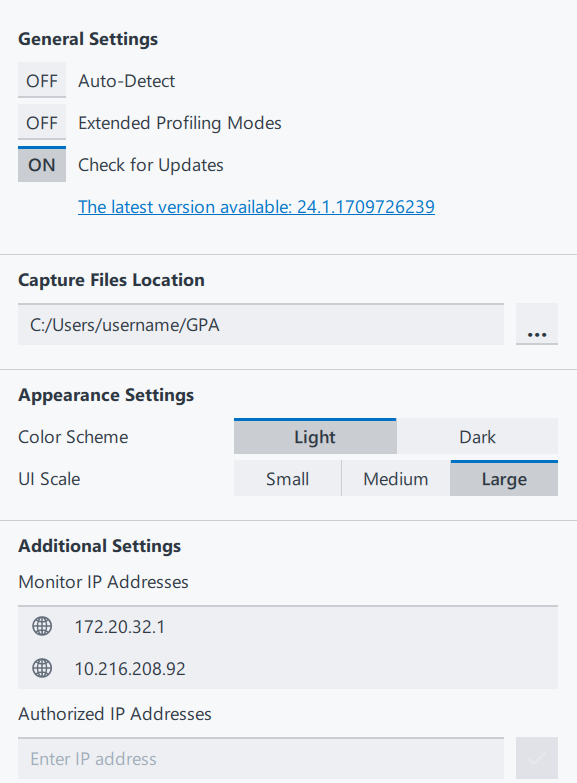
General Settings:
(Windows* only) Turn ON the Auto-Detect toggle button to automatically start analyzing DirectX* applications that were not launched through the Graphics Monitor. For example, if they were launched through the Windows* Explorer or a console command. If this button is on, the command line of any graphics application is added to the Application list in the Desktop Applications Tab. All child processes started from graphics applications are also automatically added to the Application list. Auto-detection of launched applications does not apply to universal Windows* applications .
Turn ON the Extended Profiling Modes toggle button to enable the selection of a specific graphics API in the Graphics Monitor launch mode drop-down menu. Selecting one of these launch mode entries enables you to only capture performance data from a specific graphics API. Use this feature for more accurate performance of Intel® GPA. It is most recommended to turn ON Extended Profiling Modes toggle button, if your project uses multiple APIs.
Turn OFF the Check for Updates toggle button to disable update notifications. By default, Intel GPA notifies you when a newer version of the product or Intel® Graphics Driver is available.
NOTE:If an update is available, an exclamation mark in a red circle appears on the Settings button: .
.
Use the Capture Files Location option to set a folder to save captured frames, traces or streams. The folder is defined as Current when you open Frame Capture or Trace Capture windows.
Appearance Settings:
Use the Color scheme setting to change the color schema of the Graphics Monitor interface: Light (default) or Dark.
Use the UI Scale setting to change the size of the Graphics Monitor window and its elements to Small, Medium, or Large (default).
Additional Settings:
Use the Monitor IP Addresses field to identify network IP address(es) of the local system.
Use the Authorized IP addresses field to view and change the list of target systems authorized to connect to your host system. In this field, you can view and change the list of analysis systems authorized to connect to your target system automatically:
To authorize a new analysis system, type in a new IP address, and then click the check mark button.
To forget an analysis system, select its IP address in the list, and then click the X button.
NOTE:When a remote host system tries to connect to the local system, a notification message displays asking you to accept the connection.