Visible to Intel only — GUID: GUID-CF5639CF-2E1D-4FE1-8997-4C1939B7BD0B
Visible to Intel only — GUID: GUID-CF5639CF-2E1D-4FE1-8997-4C1939B7BD0B
Prepare Your Program for Debugging
This section describes preparing your program for debugging.
Prepare to Debug Using the Command Line
To prepare your program for debugging when using the command line:
Correct any compilation and linker errors.
In a command window, such as the Fortran command window available from the Intel® Fortran program folder, compile and link the program with full debug information and no optimization:
Linux*
ifort -g file.f90Windows*
ifort /debug:full file.f90
On Linux, specify the g compiler option to create unoptimized code and provide the symbol table and traceback information needed for symbolic debugging. The notraceback option cancels the traceback information.
On Windows, specify the debug compiler option with keyword full to produce full debugging information. It produces symbol table information needed for full symbolic debugging of unoptimized code and global symbol information needed for linking.
Prepare to Debug Using Visual Studio*
The following applies to Windows* operating systems only.
To prepare your program for debugging when using the integrated development environment (IDE):
Start the IDE (select the appropriate version of Visual Studio* in the program folder).
Open the appropriate solution (using the Solution menu, either Open Solution or Recent Projects).
Open the Solution Explorer View.
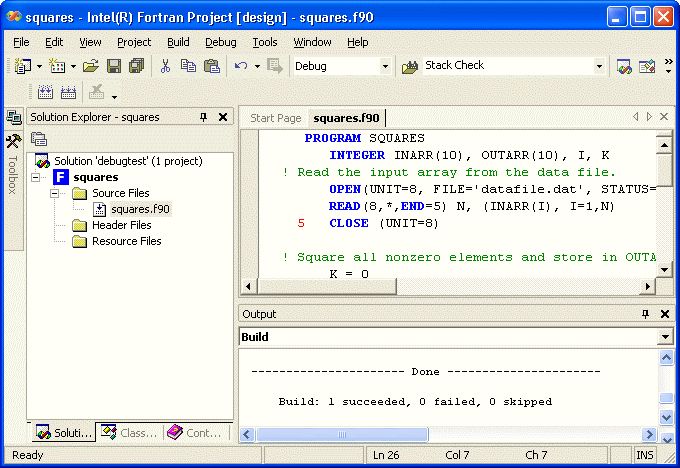
To view the source file to be debugged, double-click on the file name. The screen resembles the following:

In the Build menu, select Configuration Manager and select the Debug configuration.
To check your project settings for compiling and linking, select the project name in Solution Explorer . Now, in the Project menu, select Properties , then click the Fortran folder in the left pane. Similarly, to check the debug options set for your project (such as command arguments or working directory), click the Debugging folder in the Property Pages dialog box.
To build your application, select Build > Build Solution.
Eliminate any compiler diagnostic messages using the text editor to resolve problems detected in the source code and recompile if needed.
Set breakpoints in the source file and debug the program. For more information, see Debugging the Squares Example Program.