A newer version of this document is available. Customers should click here to go to the newest version.
Visible to Intel only — GUID: GUID-6FD5513E-1519-47D7-A801-3A24B539DD72
Visible to Intel only — GUID: GUID-6FD5513E-1519-47D7-A801-3A24B539DD72
Visual Studio* Integration
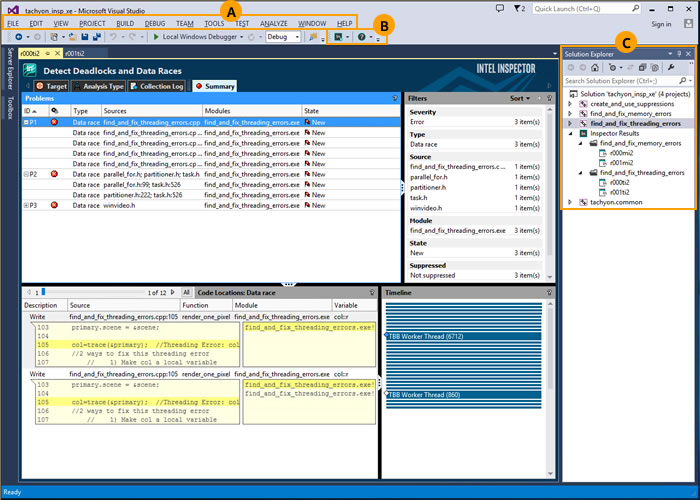
Intel® Inspector integrates into the Visual Studio* integrated development environment (IDE) and can be accessed from the menus, toolbar, and Solution Explorer in the following manner:

The menu, toolbar, and Solution Explorer offer different ways to perform many of the same functions. |
|
A |
Use the Tools > Intel Inspector [version] menu to create analysis results; compare results; and import result archive files, results not associated with a project, and results from other Intel error-detection products into the current project. |
B |
Use the Intel Inspector toolbar to create analysis results, compare results, configure projects, and open documentation resources. |
C |
Solution Explorer context menus (right-click to open):
|
Visual Studio 2022 Integration
Intel Inspector provides lightweight integration into Visual Studio 2022. You can launch a standalone Intel Inspector for your Visual Studio project as follows:
Select the Tools > Open Intel Inspector menu item
Click the
 Open Intel Inspector toolbar icon
 Right-click the project entry in the Solution Explorer and select Intel Inspector > Open Intel Inspector from the context menu.
The standalone Intel Inspector graphical version opens inheriting the project properties of the target selected in Visual Studio.
In Visual Studio 2022, you can also open the documentation resources for Intel Inspector as follows:
Select the Help > Intel Inspector menu item and choose a required documentation format from the sub-menu.
Click the drop-down control at the
 toolbar icon and choose a documentation format.