A newer version of this document is available. Customers should click here to go to the newest version.
Examine Data Transfers for Modeled Regions
Accuracy Level
Medium
Enabled Analyses
Survey + Characterization (Trip Counts and FLOP with cache simulation and light data transfer simulation) + Performance Modeling with no assumed dependencies
Result Interpretation
After running the Offload Modeling perspective with Medium accuracy, you get an extended Offload Modeling report, which provides information about memory and cache usage and taxes of your offloaded application. In addition to the basic data, the result includes:
- More accurate estimations of traffic and time for all cache and memory levels.
- Measured data transfer and estimated data transfer between host and device memory.
- Total data for the loop/function from different callees.
Offload Modeling perspective assumes a loop is parallel if its dependency type is unknown. It means that there is no information about a loop from a compiler or the loop is not explicitly marked as parallel, for example, with a programming model (OpenMP*, SYCL, Intel® oneAPI Threading Building Blocks).
If you had a report generated for a lower accuracy, all offload recommendations, metrics, and speed-up will be updated to be more precise taking into account new data.
In the Accelerated Regions tab of the Offload Modeling report, review the metrics about memory usage and data transfers.
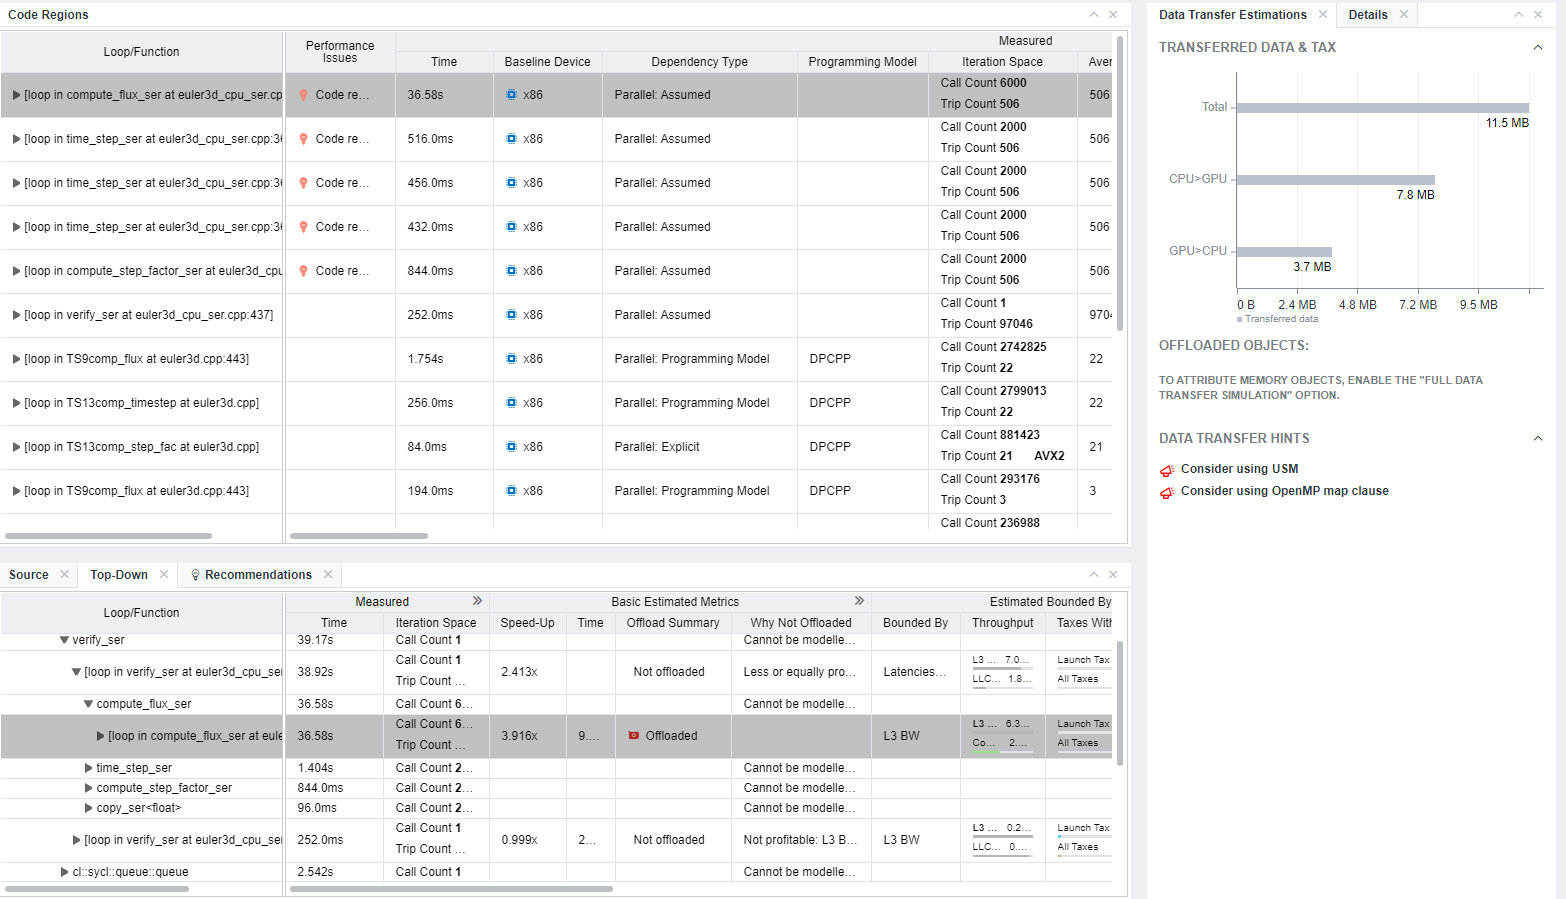
- In the Code Regions metrics table:
- In the Estimated Bounded By column, review how much time is spent to transfer data (data transfer tax). In the Taxes with Reuse column, see the biggest and total time taxes paid for offloading a code regions to a target platform.
Expand the Estimated Bounded By group to see a full picture of all time taxes paid for offloading the region to the target platform.
- In the Estimated Data Transfer with Reuse column, review how much data is transferred per kernel in different directions (from host to device, from device to host). Expand the column to see data per memory level.
- In the Memory Estimations column, see how well your application uses resources of all memory levels. Expand the group to see more detailed and accurate metrics for different memory levels.
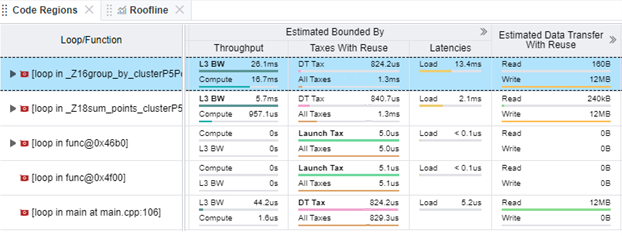
- In the Estimated Bounded By column, review how much time is spent to transfer data (data transfer tax). In the Taxes with Reuse column, see the biggest and total time taxes paid for offloading a code regions to a target platform.
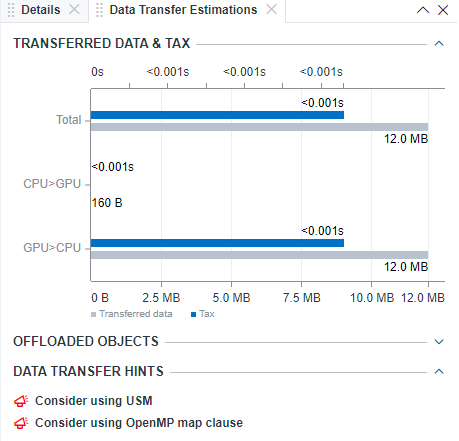
- Select a code region from the table and review the details about data transferred between host and device memory in the Data Transfer Estimations pane.
- In the Transferred Data & Tax histogram, see the distribution of data transferred between the host and target devices in each direction.
- See hints about optimizing data transfers in the selected code region.
- In the Recommendations tab, get guidance for offloading your code to a target device and optimizing it so that your code benefits the most. If the code region has room for optimization or underutilizes the capacity of the target device, Intel Advisor provides you with hints and code snippets that might be helpful to you for further code improvement.
Next Steps
To learn more about data transfers estimated between host and target device for your application, run Offload Modeling with one the following properties:
- Set the data transfer simulation under the characterization analysis to Medium and run the perspective. The result should have the Data Transfer Estimations pane extended with new data reporting information about memory objects in each code region.
Offloaded Objects pane shows a list of memory objects with data about each object aggregated between different instances of one region.

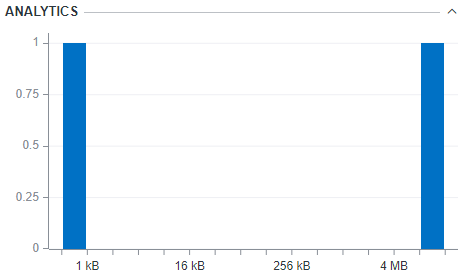
Analytics histogram shows the number of memory objects that the selected region accessed distributed by their size.
- Set the data transfer simulation under the characterization analysis to High and enable the Data Reuse Analysis checkbox under the Performance Modeling analysis. With data reuse analysis, Intel Advisor detects groups of parallel code regions that can reuse memory objects transferred to a target GPU device. Such memory objects can be transferred to GPU only once and reused, which can improve data transfer efficiency.
The result should have data transfer metrics in the Code Regions pane estimated with and without data reuse for each code region. Examine the metrics in the Estimated Bounded By and Estimated Data Transfer with Reuse columns to check if a code region can benefit from applying data reuse.
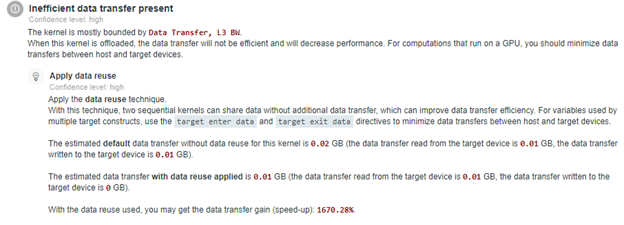
For code regions that can benefit from data reuse, you should see Apply Data Reuse guidance in the Recommendations tab. The guidance shows the data transfer estimated with and without data reuse and the performance gain from applying the data reuse. It also explains how you can apply the data reuse technique to your code.
- If you think that the estimated speedup is enough and the application is ready to be offloaded, rewrite your code to offload profitable code regions to a target platform and measure performance of GPU kernels with GPU Roofline Insights perspective.